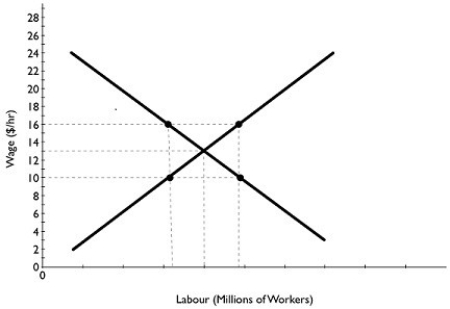
Figure 5.1  Alt text for Figure 5.1: In figure 5.1, a graph of the labour market.
Long description for Figure 5.1: The x-axis is labelled, labour (millions of workers) .The y-axis is labelled, wage (dollars per hour) , ranging from 0 to 28 in increments of 2.2 intersecting lines are shown.A line slopes down from the top left of the quadrant, near the value 24 on the y-axis, to the bottom right corner, near the end of the x-axis.A second line slopes up from the bottom left corner of the quadrant, near the origin, to the top right corner.4 points plotted along the 2 sloping lines, and the point of intersection of the 2 lines, are connected to the corresponding values on the x-axis, and to the values 10, 13 and 16 on the y-axis.
-Refer to Figure 5.1.Based on the graph of the labour market above, if a minimum wage is set at $10 per hour, which of the following will occur?
Definitions:
Cost Reconciliation Report
A financial report used to compare and reconcile the estimated costs to the actual costs incurred for a specific project or during a particular period.
Weighted-Average Method
An inventory costing method that calculates the cost of goods sold and ending inventory based on the average cost of all units available for sale.
Percentage Completion
An accounting method used to recognize revenue and expenses in long-term projects, based on the project's degree of completion.
Weighted-Average Process Costing System
A costing methodology that averages the costs of different production batches over a period to calculate the cost per unit.
Q98: Unemployment caused by a business cycle recession
Q116: A decrease in the real interest rate
Q139: The value of what a Canadian-owned Tim
Q162: Nominal income is equal to real income
Q175: Refer to Figure 7.1.Many countries in Africa
Q195: If Canada and Bolivia have annual per
Q206: Jack was unemployed two weeks ago but
Q223: If real GDP per capita in Canada
Q245: What type of consumer goods are most
Q267: Macroeconomics, as opposed to microeconomics, includes the