Multiple Choice
Table 5.14 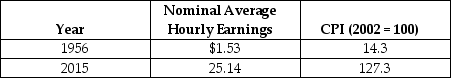 The table above reports the nominal average hourly wage and the consumer price index for 1956 and 2012.
-Refer to Table 5.14.The percentage change in real average wage from 1956 to 2015 equals
Definitions:
Related Questions
Q34: As the economy nears the end of
Q34: When an economy faces diminishing returns,<br>A)the slope
Q113: Use the equations for public and private
Q119: High-income countries are also referred to as<br>A)developing
Q175: GDP is not a perfect measure of
Q233: Refer to Table 4.1.Suppose that a simple
Q235: If the number employed is 190 million,
Q235: Refer to Table 4.11.Real GDP for Tyrovia
Q245: In December 2015, CHCH TV laid-off 129
Q245: What type of consumer goods are most