Figure 6.1 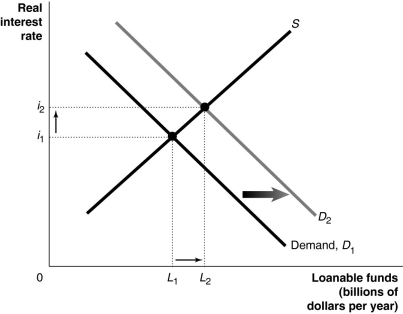 Alt text for Figure 6.1: In figure 6.1, a graph comparing loanable funds and real interest rate.
Long description for Figure 6.1: The x-axis is labelled, loanable funds (billions of dollars per year) , with values L1 and L2 marked.The y-axis is labelled, real interest rate, with values i1 and i2 marked.3 lines are plotted; Demand D1, D2 and S.Line D1 begins at the top left corner and slopes down to centre bottom.Line D2 follows the same slope as D1, but is plotted to the right.The line S begins near the origin and slopes up to the top right corner.The area between lines D1 and D2 is indicated by a right pointing arrow.Line S intersects line D1 at the point (L1, i1) , approximately 3 quarters of the way along both lines.S intersects D2 at the point (L2, i2) approximately 3 quarters of the way along both lines.These points of intersection are connected to the corresponding values on the x-axis and y-axis by dotted lines.Between the dotted lines, a rightward arrow points from L1 toward L2, and another arrow points up from i1 toward i2.
-Refer to Figure 6.1.Which of the following is consistent with the graph depicted above?
Definitions:
Stimulus Motives
Internal states that prompt inquisitive, exploratory, and seeking behaviors in the absence of physical need or emotional distress.
Maslow
Refers to Abraham Maslow, an American psychologist renowned for creating Maslow's hierarchy of needs, a theory of psychological health predicated on fulfilling innate human needs.
Higher Motives
Aspirations or desires that transcend basic physiological or safety needs, focusing instead on personal growth, fulfillment, and the well-being of others.
Drive Reduction Theory
A psychological concept that suggests motivation arises from the desire to reduce an uncomfortable internal state caused by unmet needs.
Q47: Disposable household income equals household income<br>A)minus personal
Q62: If the per-worker production function shifts up,<br>A)it
Q117: How would the equilibrium interest rate respond
Q121: Consider the following data for a closed
Q126: Canada<br>A)currently is one of the most corrupt
Q131: When deflation occurs,<br>A)the real interest rate is
Q196: Refer to Table 4.30.Based on the table
Q254: Refer to Table 4.24.Suppose that a very
Q275: During the Great Depression, economists first began
Q294: If firms find that consumers are purchasing