Figure 6.6 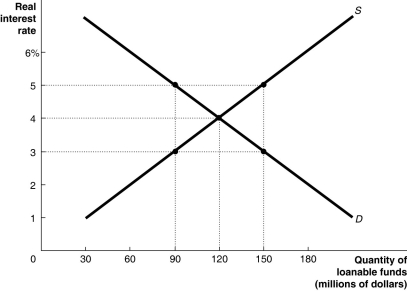 Alt text for Figure 6.6: In figure 6.6, a graph shows loanable funds market in equilibrium.
Long description for Figure 6.6: The x-axis is labelled, quantity of loanable funds (millions of dollars) , ranging from 0 to 180 in increments of 30.The y-axis is labelled real interest rate, ranging from 0 to 6% in increments of 1.2 intersecting lines are shown.A line labelled D begins at the top left corner and slopes down toward the end of the x-axis.Another line labelled S begins near the origin and slopes upward to the top right corner.5 points are plotted on these two lines as (90, 5) , (90, 3) , (120, 4) , (150, 5) , (150, 3) .These points are connected to their respective coordinates on the x-axis and y-axis using dotted lines.
-Refer to Figure 6.6.The loanable funds market is in equilibrium, as shown in the figure above.An increase in the supply of loanable funds could result in which of the following combinations of the real interest rate and quantity of loanable funds at a new equilibrium?
Definitions:
Vision
Vision refers to the ability to see, the act of envisioning future possibilities, or a mental image of what the future could or should be like.
Perception
The sorting out, interpretation, analysis, and integration of stimuli involving the sense organs and brain.
Sensation
The physical stimulation of the sense organs.
Stimuli
External factors or events that elicit a response from a sensory organ or organism.
Q13: If national income increases by $20 million
Q27: The Employment Insurance program<br>A)increases the amount of
Q76: Upon your graduation from university, you find
Q107: When the government runs a budget deficit,
Q158: In 2016 the federal government was forecast
Q159: Explain why you would rather be a
Q204: Which of the following would increase public
Q252: Increases in the price level will<br>A)lower consumption
Q259: The labour force equals the number of
Q267: An increase in taxes will _ consumption