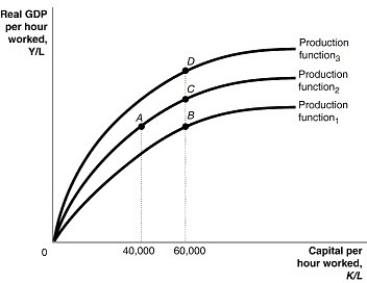
Figure 7.1  Alt text for Figure 7.1: In figure 7.1, a graph comparing capital per hour worked and real GDP per hour worked.
Long description for Figure 7.1: The x-axis is labelled, capital per hour worked, K/L, with values 40,000 and 60,000 marked.The y-axis is labelled, real GDP per hour worked, Y/L, with 0 at the vertex.3 concave curves, each originating from the vertex are shown.4 points A, B, C, and D are plotted such that point A has 40,000 as the x coordinate, and points B, C, and D have 60,000 as the x coordinate.The 3 curves pass through these points.The curve labelled, Production function 1, passes through point B.The curve labelled, Production function 2, passes through points A and C.The curve labelled, Production function 3, passes through point D.
-Refer to Figure 7.1. Which of the following could cause an economy to move from point C to B?
Definitions:
Process Costing
An accounting methodology used for homogeneous products, where the costs are assigned to batches of products instead of individual units, suitable for manufacturing environments with continuous production processes.
Continuous Production
A manufacturing process where materials are produced without interruption across various stages of production, typically used for high-volume, low-variety products.
Raw Materials Inventory
Items and components stored that are used in the manufacturing process to create finished goods.
Stores Ledger Cards
A record-keeping tool that tracks the quantity and value of materials on hand in a storeroom.
Q11: Refer to Table 6.2.Using the table above,
Q23: Which of the following will result in
Q38: _ save a _ of their income.This
Q55: Potential GDP in Canada<br>A)does not change over
Q61: Why does the substitution bias cause the
Q67: Refer to Table 5.14.The real average hourly
Q148: Which of the following is a true
Q170: Describe how a lender can lose during
Q282: There are no costs to inflation if
Q291: Refer to Figure 8.4.If the Canadian economy