Figure 7.3 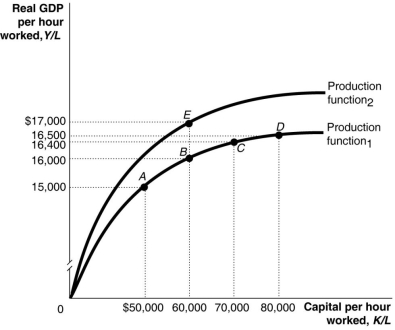 Alt text for Figure 7.3: In figure 7.3, a graph, comparing capital per hour worked and real GDP per hour worked.
Long description for Figure 7.3: The x-axis is labelled, capital per hour worked, K/L.The y-axis is labelled, real GDP per hour worked, Y/L.2 concave curves originating from 0 at the vertex are shown.5 points A ($50000, $15000) , B ($60000, $16000) , C ($70000, $16400) , D ($80000, $16500) , and E ($60000, $17000) are plotted.The curve labelled Production function 1, passes through points A, B, C, and D.The curve labelled Production function 2, passes through point E.These 5 points are connected to their respective coordinates on the x and y-axis with dotted lines.
-Refer to Figure 7.3.Which of the following would cause an economy to move from a point like A in the figure above to a point like B?
Definitions:
L-dopa
A precursor to dopamine used in the treatment of Parkinson's disease to increase dopamine levels in the brain.
Inhibitory Neurotransmitter
Chemical substances released by neurons in the brain to reduce the activity of other neurons, playing a key role in the modulation of neural circuits.
Forebrain
The anterior part of the brain, including the cerebral hemispheres, the thalamus, and the hypothalamus, responsible for complex behavioral and cognitive processes.
Cerebellum
A part of the brain located at the back of the skull, primarily responsible for coordinating voluntary movements, balance, and posture.
Q22: If taxes are less than transfers plus
Q55: Potential GDP in Canada<br>A)does not change over
Q71: Which of the following would you expect
Q91: A(n)_ comes to an end with a
Q92: Between 1970 and now, the percentage of
Q108: An economy can improve its standard of
Q168: Potential GDP refers to<br>A)the level of GDP
Q185: According to the text, there are three
Q252: Increases in the price level will<br>A)lower consumption
Q260: Inflation usually increases during a recession and