Figure 7.3 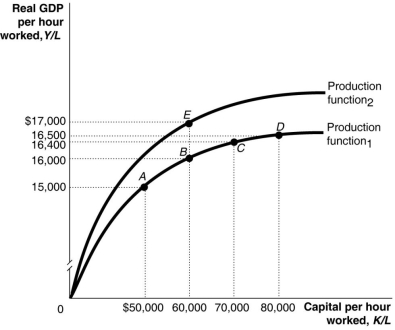 Alt text for Figure 7.3: In figure 7.3, a graph, comparing capital per hour worked and real GDP per hour worked.
Long description for Figure 7.3: The x-axis is labelled, capital per hour worked, K/L.The y-axis is labelled, real GDP per hour worked, Y/L.2 concave curves originating from 0 at the vertex are shown.5 points A ($50000, $15000) , B ($60000, $16000) , C ($70000, $16400) , D ($80000, $16500) , and E ($60000, $17000) are plotted.The curve labelled Production function 1, passes through points A, B, C, and D.The curve labelled Production function 2, passes through point E.These 5 points are connected to their respective coordinates on the x and y-axis with dotted lines.
-Refer to Figure 7.3. A large group of new workers entering the labour force is shown in the figure above by a movement from
Definitions:
Disaffirm
The legal right of a party to reject or annul a contract or agreement, often associated with contracts entered into by minors.
Power of Avoidance
The legal ability to nullify or cancel a contractual agreement or transaction under certain conditions.
Disaffirmance
The legal right of a party to renounce or revoke a contract or agreement, particularly relevant in cases involving minors or instances of fraud.
Ratify
To formally approve or confirm an agreement or act, making it officially valid.
Q53: _ are financial securities that represent partial
Q81: According to Joseph Schumpeter, economic growth is
Q91: A(n)_ comes to an end with a
Q114: An economy that grows too slowly fails
Q123: Which of the following accurately describes the
Q135: A government budget surplus from reduced government
Q157: According to the World Bank, in 2013
Q180: Which of the following correctly describes how
Q184: Tariffs and trade wars cause net exports
Q209: If, in an economy experiencing inflation, the