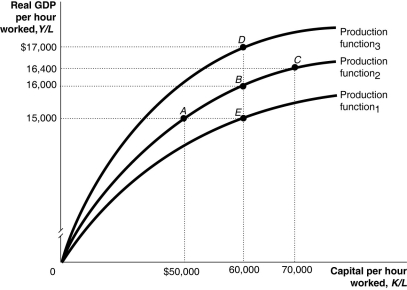
Figure 7.4  Alt text for Figure 7.4: In figure 7.4, a graph representing per-worker production functions.
Long description for Figure 7.4: The x-axis is labelled, capital per hour worked, K/L.The y-axis is labelled, real GDP per hour worked, Y/L.3 concave curves originating from 0 at the vertex are shown.5 points A ($50000, $15000) , B ($60000, $16000) , C ($70000, $16400) , D ($60000, $17000) , and E ($60000, $15000) are plotted.The curve labelled, Production function 1, passes through point E.The curve labelled, Production function 2, passes through points A, B, and C.The curve labelled, Production function 3, passes through point D.These 5 points are connected to their respective coordinates on the x-axis and y-axis with dotted lines.
-Refer to Figure 7.4.Suppose the economy gains more capital per hour worked and experiences technological change.This is shown in the figure above by the movement from
Definitions:
Contractual Rate
The interest rate stated in a contract, such as in a loan agreement or bond indenture, determining the amount of interest payments.
Premium on Bonds Payable
The amount by which the sale price of a bond exceeds its face value, reflecting higher-than-market interest rates or increased demand for the bond.
Amortization
The process of spreading out a loan or intangible asset cost over a fixed period of time for accounting and tax purposes.
Straight-Line Method
A method of allocating the cost of an asset evenly over its useful life.
Q35: An increase in the price level in
Q40: Given Table 8.5 below, fill in the
Q41: The purchase of stocks and bonds issued
Q139: If the Canadian dollar decreases in value
Q162: Refer to Table 8.14.Using the table above,
Q177: As the economy nears the end of
Q189: Inflation tends to _ during the expansion
Q209: If, in an economy experiencing inflation, the
Q224: An increase in the demand for loanable
Q229: Labour productivity will increase if the _