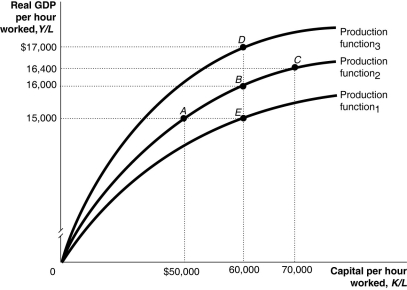
Figure 7.4  Alt text for Figure 7.4: In figure 7.4, a graph representing per-worker production functions.
Long description for Figure 7.4: The x-axis is labelled, capital per hour worked, K/L.The y-axis is labelled, real GDP per hour worked, Y/L.3 concave curves originating from 0 at the vertex are shown.5 points A ($50000, $15000) , B ($60000, $16000) , C ($70000, $16400) , D ($60000, $17000) , and E ($60000, $15000) are plotted.The curve labelled, Production function 1, passes through point E.The curve labelled, Production function 2, passes through points A, B, and C.The curve labelled, Production function 3, passes through point D.These 5 points are connected to their respective coordinates on the x-axis and y-axis with dotted lines.
-Refer to Figure 7.4.Suppose the per-worker production function in the figure above represents the production function for the Canadian economy.If Canada decided to cut its support of university research in half, this would cause a movement from
Definitions:
Total Revenue
The overall income generated by a business from selling its goods or services before any costs are deducted.
Value of the Marginal Product
The additional revenue generated by employing one more unit of input, such as labor or capital.
Total Cost
The sum of all expenses incurred in the production of goods or services, including fixed and variable costs.
Total Revenue
The total income received by a firm from selling its goods or services before any costs or expenses are deducted.
Q12: The aggregate expenditure model focuses on the
Q18: If labour productivity growth slows down in
Q95: The per-worker production function has a _
Q100: What impact does a decrease in the
Q110: C = 3,600 + (MPC)Y<br>I = 1,200<br>G
Q117: If real GDP per capita in Canada
Q134: In comparison to a government that runs
Q135: An economic growth model<br>A)explains changes in nominal
Q168: Potential GDP refers to<br>A)the level of GDP
Q221: Explain why a centrally-planned economy might not