Using the points on the diagram below, identify which combinations of these points illustrate diminishing returns to capital.Give a brief explanation to support your answer. 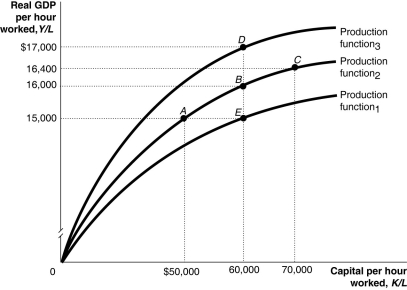 Alt text for Question 101: For question 101, a graph illustrating diminishing returns to capital
Long description for Question 101: The x-axis is labelled, capital per hour worked, K/L.The y-axis is labelled, real GDP per hour worked, Y/L.3 concave curves originating from 0 at the vertex are shown.5 points A ($50000, 15000), B (60000, 16000), C (70000, 16400), D (60000, $17000), and E (60000, 15000)are plotted.The curve labelled, Production function 1, passes through point E.The curve labelled, Production function 2, passes through points A, B, and C.The curve labelled, Production function 3, passes through point D.These 5 points are connected to their respective coordinates on the x and y-axis with dotted lines.
Definitions:
Real Rate of Return
The rate of profit or loss on an investment after adjusting for inflation, providing a more accurate measure of purchasing power.
Inflation Rate
The percentage rate at which the general level of prices for goods and services is rising, eroding purchasing power over time.
Interest Rate
The cost of borrowing money, typically expressed as a percentage of the amount borrowed, over a specific period of time.
Investment Decision
The process of making choices about where to allocate limited resources or capital to generate the highest potential return.
Q24: Globalization is positively associated with<br>A)poverty.<br>B)declining rates of
Q31: Household wealth is defined as the value
Q57: Firms in a small economy anticipated that
Q80: _ is the ease with which a
Q92: Centrally-planned economies tend to grow more quickly
Q109: If the federal government regulated airline ticket
Q153: Financial markets and financial intermediaries comprise the
Q181: Suppose Canada experiences a long period of
Q183: Since 1980,<br>A)the Canadian economy has spent more
Q267: An increase in taxes will _ consumption