Figure 7.3 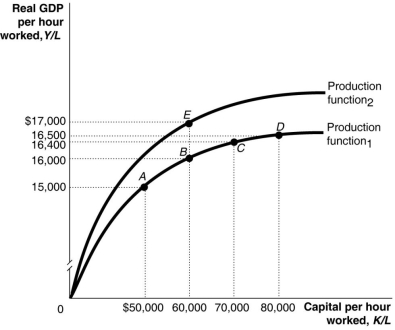 Alt text for Figure 7.3: In figure 7.3, a graph, comparing capital per hour worked and real GDP per hour worked.
Long description for Figure 7.3: The x-axis is labelled, capital per hour worked, K/L.The y-axis is labelled, real GDP per hour worked, Y/L.2 concave curves originating from 0 at the vertex are shown.5 points A ($50000, $15000) , B ($60000, $16000) , C ($70000, $16400) , D ($80000, $16500) , and E ($60000, $17000) are plotted.The curve labelled Production function 1, passes through points A, B, C, and D.The curve labelled Production function 2, passes through point E.These 5 points are connected to their respective coordinates on the x and y-axis with dotted lines.
-Refer to Figure 7.3. A large group of new workers entering the labour force is shown in the figure above by a movement from
Definitions:
Continental Crust
The relatively thick part of the Earth's crust that forms the large landmasses. It is generally older and more complex than the oceanic crust.
Elevation
The height of a point or object above a reference level, typically above sea level.
Stretched
In geological contexts, stretched refers to the extension or elongation of the Earth's crust as a result of tectonic activities, leading to the formation of features such as rift valleys.
Erode Material
Refers to substances or objects that have experienced erosion, the process where natural forces like water and wind remove soil, rock, or dissolved material from one location and then transport it to another.
Q5: Some economists argue that the productivity slowdown
Q29: The Conference Board of Canada's Consumer Confidence
Q59: Would a larger multiplier lead to longer
Q120: A consumer price index of 160 in
Q122: Consumption spending is $5 million, planned investment
Q170: The aggregate expenditure model focuses on the
Q189: By offering more generous unemployment insurance programs,
Q190: On the 45-degree line diagram, the 45-degree
Q204: Which of the following would increase public
Q238: If net taxes rise by $150 billion