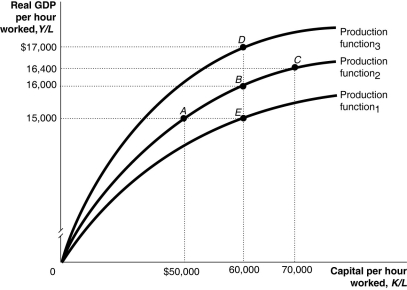
Figure 7.4  Alt text for Figure 7.4: In figure 7.4, a graph representing per-worker production functions.
Long description for Figure 7.4: The x-axis is labelled, capital per hour worked, K/L.The y-axis is labelled, real GDP per hour worked, Y/L.3 concave curves originating from 0 at the vertex are shown.5 points A ($50000, $15000) , B ($60000, $16000) , C ($70000, $16400) , D ($60000, $17000) , and E ($60000, $15000) are plotted.The curve labelled, Production function 1, passes through point E.The curve labelled, Production function 2, passes through points A, B, and C.The curve labelled, Production function 3, passes through point D.These 5 points are connected to their respective coordinates on the x-axis and y-axis with dotted lines.
-Refer to Figure 7.4.The movement from A to B to C illustrates
Definitions:
Equilibrium Price
The price at which the quantity of a good or service demanded by consumers equals the quantity supplied by producers, resulting in market balance.
Market Demand
The total demand for a product or service within a particular market, including all consumers' willingness and ability to purchase at various prices.
Purely Competitive Market
A market structure characterized by a large number of firms or sellers, each of which has a relatively small market share and sells a homogeneous product, with no single firm able to influence market price.
Average Fixed Cost
The fixed costs of production (costs that do not vary with the level of output) divided by the quantity of output produced.
Q11: Creative destruction means that<br>A)firms develop new products
Q64: If GDP grows at a rate of
Q68: Disposable income is defined as<br>A)national income -
Q133: Foreign investment can give a low-income country<br>A)access
Q152: Which of the following countries had the
Q176: The nominal interest rate plus the inflation
Q213: According to Nobel Laureate Douglass North, one
Q236: The real wage equals the nominal wage
Q274: If an increase in investment spending of
Q275: In a small European country, it is