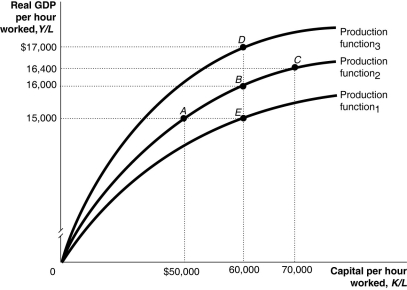
Figure 7.4  Alt text for Figure 7.4: In figure 7.4, a graph representing per-worker production functions.
Long description for Figure 7.4: The x-axis is labelled, capital per hour worked, K/L.The y-axis is labelled, real GDP per hour worked, Y/L.3 concave curves originating from 0 at the vertex are shown.5 points A ($50000, $15000) , B ($60000, $16000) , C ($70000, $16400) , D ($60000, $17000) , and E ($60000, $15000) are plotted.The curve labelled, Production function 1, passes through point E.The curve labelled, Production function 2, passes through points A, B, and C.The curve labelled, Production function 3, passes through point D.These 5 points are connected to their respective coordinates on the x-axis and y-axis with dotted lines.
-Refer to Figure 7.4.Suppose the economy gains more capital per hour worked and experiences technological change.This is shown in the figure above by the movement from
Definitions:
LAC Curves
The Long-Run Average Cost curves, which show the minimum average cost of production at different levels of output.
LMC Curves
Abbreviation for Long-Run Marginal Cost curves, which represent the cost to produce one additional unit of goods when all inputs can be varied.
Returns to Scale
The change in output resulting from proportional change in all inputs (factors of production); can be increasing, constant, or decreasing.
Returns to Scale
The change in output resulting from a proportional change in all inputs (factors of production); it identifies whether increasing inputs leads to proportionate, more than proportionate, or less than proportionate changes in output.
Q24: Goods that have been produced but not
Q41: During the recession phase of the business
Q120: Describe the process of "creative destruction" using
Q126: Canada<br>A)currently is one of the most corrupt
Q127: For how long does a patent give
Q168: The key idea of the aggregate expenditure
Q182: The budget deficit is defined as<br>A)T -
Q195: If economists forecast a decrease in aggregate
Q199: You lend $5,000 to a friend for
Q245: The difference between GDP and disposable income