Figure 8.3 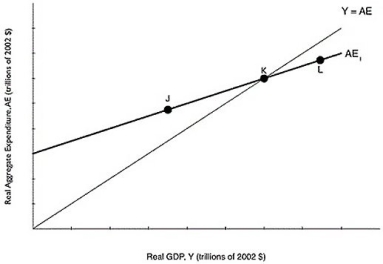 Alt text for Figure 8.3: In figure 8.3, a graph comparing real GDP and real aggregate expenditure.
Long description for Figure 8.3: The x-axis is labelled, real GDP, Y (trillions of 2002 dollars) .The y-axis is labelled, real aggregate expenditure, AE (trillions of 2002 dollars) .Line Y = AE, originates at the vertex and slopes up to the top right corner.Line AE1, begins a little less than half way along the x-axis and slopes up to the end of the x-axis.Both these lines intersect at point K, approximately 3 quarters of the way along both lines.Point J is plotted a little less than half way along line AE1, to the left of point K.Point L is marked close to the right end of the line AE1, to the right of point K.
-Refer to Figure 8.3. At point J in the figure above, which of the following is true?
Definitions:
Common Stock
A form of corporate equity ownership, representing a share in the ownership of a company and a claim on a part of its profits.
Treasury Bills
Treasury bills are short-term government securities issued at a discount from the face value and mature at par, used by governments to raise funds to meet short-term financial needs.
Unsystematic Risk
The risk that is unique to a specific company or industry, which can be mitigated through diversification.
Q53: The aggregate demand curve shows the relationship
Q75: Suppose the economy is at full employment
Q168: The rapid growth of the Chinese economy
Q201: If firms sell exactly what they expected
Q221: After an unexpected _ in the price
Q252: Increases in the price level will<br>A)lower consumption
Q265: The lower-income industrial countries are catching up
Q266: Refer to Table 10.1.Suppose a transaction changes
Q287: The marginal propensity to consume is the
Q291: Refer to Figure 8.4.If the Canadian economy