At each of the three points in the following graph, indicate whether planned aggregate expenditure is greater than, equal to, or less than GDP. 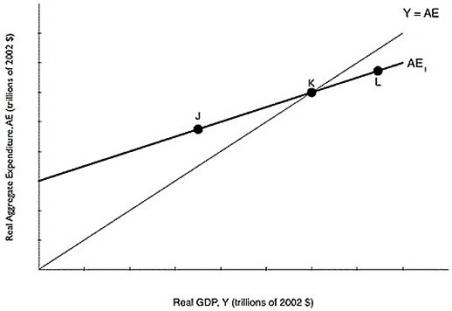 Alt text for Question 47: For question 47, a graph comparing planned aggregate expenditure and GDP.
Long description for Question 47: The x-axis is labelled, real GDP, Y (trillions of 2002 dollars).The y-axis is labelled, real aggregate expenditure, AE (trillions of 2002 dollars).Line Y = AE originates at the vertex and slopes up to the top right corner.Line AE1, begins a little less than half way along the x-axis and slopes up to the end of the x-axis.Both lines intersect at point K, approximately 3 quarters of the way along both lines.Point J is plotted a little less than half way along line AE1, to the left of point K.Point L is plotted close to the right end of line AE1, to the right of point K.
Definitions:
Company Management
The group of individuals responsible for making major decisions, overseeing operations, and managing the resources and strategy of a company.
Capital Budgeting
The process by which a business evaluates and selects long-term investments based on their potential to generate future profit.
Long-Term Investments
Long-term investments are financial assets intended to be held for a period longer than one year, aiming for higher returns over time.
Net Working Capital
The difference between a company's current assets and current liabilities, indicating the liquidity and operational efficiency.
Q50: During World War II, prisoners of war
Q79: If the marginal propensity to save is
Q116: Which of the following is true?<br>A)National income
Q127: Suppose the Bank of Canada purchases $10,000
Q127: A stock market crash that causes stock
Q148: In a small economy in 2017, aggregate
Q164: The simple deposit multiplier is the ratio
Q166: Which of the following is not a
Q190: An economy is likely to recover from
Q252: Georg, a German citizen, just purchased 10