Figure 8.8 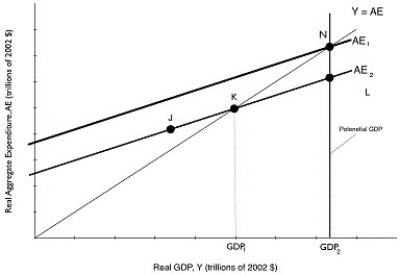 Alt text for Figure 8.8: In figure 8.8, a graph depicting potential GDP.
Long description for Figure 8.8: The x-axis is labelled, real GDP, Y (trillions of 2002 dollars) with values GDP1 and GDP2 marked.The y-axis is labelled, real aggregate expenditure, AE (trillions of 2002 dollars) .Line AE1, begins a little less than half way on the x-axis and slopes up to the end of the x-axis.Line AE2, is to the right of AE1 and is on a similar path, sloping up to the top right corner.Line Y = AE, originates at the vertex and slopes up to the top right corner.Line Y = AE intersects line AE2 at point K, half way along both lines, and intersects line AE1 at point N, plotted close to the right end of line AE1.Point J is plotted a little less than half way along line AE2, to the left of point K.Point L is plotted close to the right end of line AE2, to the right of point K.Point K is connected to its x-coordinate, GDP1, with a dotted line.A straight line, representing potential GDP, is drawn connecting points N and L with their x-coordinate, GDP2, such that it is parallel to line connecting point K with value GDP1.
-Refer to Figure 8.8.Potential GDP equals $500 billion.The economy is currently producing GDP1, which is equal to $450 billion.If the MPC is 0.8, then how much must autonomous spending change for the economy to move to potential GDP?
Definitions:
U.S. Dollar
The official currency of the United States, often used as a standard unit of currency in international markets due to its widespread acceptance.
Canadian Exports
Canadian exports refer to goods or services that are produced in Canada and sold to buyers in other countries.
Cultural Sensitivity
Awareness and understanding of the cultural differences and similarities within and between groups.
Cyberspace
A digital environment where communication over computer networks occurs.
Q25: Refer to Figure 8.4.If the Canadian economy
Q39: If aggregate expenditure is more than GDP,
Q69: In 1973, the Club of Rome published
Q91: Stagflation is often a result of<br>A)a negative
Q97: Given the equations for C, I, G,
Q113: Foreign direct investment occurs when a Chinese
Q148: _ of unemployment during _ make it
Q157: Given Table 8.6 below, fill in the
Q229: As predicted by the economic growth model,
Q235: Canada followed the U.S.into recession in 2008,