Figure 8.3 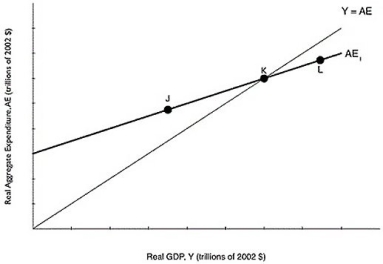 Alt text for Figure 8.3: In figure 8.3, a graph comparing real GDP and real aggregate expenditure.
Long description for Figure 8.3: The x-axis is labelled, real GDP, Y (trillions of 2002 dollars) .The y-axis is labelled, real aggregate expenditure, AE (trillions of 2002 dollars) .Line Y = AE, originates at the vertex and slopes up to the top right corner.Line AE1, begins a little less than half way along the x-axis and slopes up to the end of the x-axis.Both these lines intersect at point K, approximately 3 quarters of the way along both lines.Point J is plotted a little less than half way along line AE1, to the left of point K.Point L is marked close to the right end of the line AE1, to the right of point K.
-Refer to Figure 8.3. At point J in the figure above, which of the following is true?
Definitions:
Marketing Action
Any strategy or activity undertaken by a company to promote its products or services and achieve its marketing objectives.
Competitors' Products
Goods or services offered by companies that compete within the same market segment.
Product Characteristics
Specific attributes or features that define a product, such as quality, functionality, and design, which can influence consumer purchase decisions.
Marketing Mix
The combination of factors that can be controlled by a company to influence consumers to purchase its products, traditionally identified as product, price, place, and promotion.
Q28: To what do economists attribute the rapid
Q37: If planned aggregate expenditure is less than
Q83: What is the difference between aggregate expenditure
Q102: On the long-run aggregate supply curve,<br>A)a decrease
Q131: The formula for aggregate expenditure is<br>A)AE =
Q148: _ of unemployment during _ make it
Q184: Because firms can free ride on the
Q186: A patent grants an inventor exclusive rights
Q209: Some economists argue that the productivity slowdown
Q259: How does government support of health and