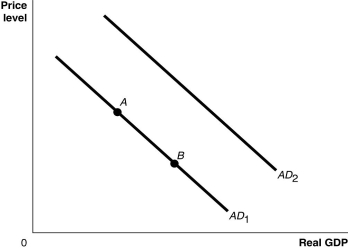
Figure 9.1  Alt text for Figure 9.1: In figure 9.1, a graph comparing real GDP and price level.
Long description for Figure 9.1: The x-axis is labelled, real GDP, and the y-axis is labelled, price level, with 0 at the vertex.Line AD1 begins in the top left corner and slopes down to the bottom center.Line AD2 follows the same slope as line AD1 but is plotted to the right.Points A and B are plotted along line AD1.Point A is a little less than half way along the left side of the line, and point B is little more than half way on the right side of the line.
-Refer to Figure 9.1.Ceteris paribus, a decrease in the growth rate of domestic GDP relative to the growth rate of foreign GDP would be represented by a movement from
Definitions:
Percent Equivalent
The fractional amount expressed as a part of one hundred.
Compound Interest
This form of interest computation involves calculating interest on both the initial principal amount and any interest that has accrued in the past periods on a loan or deposit.
Percent Equivalent
The numeric representation of a ratio or fraction as a part of 100.
Fraction
A numerical quantity that is not a whole number, represented by two numbers divided by a line, indicating part of a whole.
Q21: Starting from long-run equilibrium, use the basic
Q44: Consumer spending _ and investment spending _.<br>A)is
Q60: When Javier's income increases by $5,000, he
Q91: Stagflation is often a result of<br>A)a negative
Q96: If you transfer all of your currency
Q156: Which of the following would not be
Q200: _ describes the relationship between consumption spending
Q211: Higher interest rates increase both consumption and
Q252: Increases in the price level will<br>A)lower consumption
Q267: The desired reserves of a bank equal