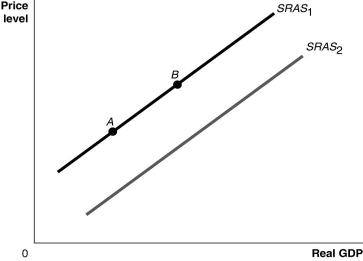
Figure 9.3  Alt text for Figure 9.3: In figure 9.3, a graph comparing real GDP and price level.
Long description for Figure 9.3: The x-axis is labelled, real GDP, with 0 at the vertex, and the y-axis is labelled, price level.2 lines are shown; SRAS1 and SRAS2.Line SRAS1 begins a little above the vertex and slopes up to the top right corner.Line SRAS2 follows the same slope as line SRAS1, but is plotted to the right.Points A and B are plotted on line SRAS1.Point A is near the left end of the line and point B is near the center of the line.
-Refer to Figure 9.3.Ceteris paribus, an increase in the expected future price level would be represented by a movement from
Definitions:
Direct Labor Hours
The total hours worked by employees directly involved in manufacturing a product or delivering a service.
Activity-Based Costing
A costing method that assigns overhead and indirect costs to specific activities related to production.
Overhead Cost Per Unit
The total indirect costs of production allocated to each unit of product.
Standard Units
Units of measure used consistently across an organization to maintain uniformity in reporting, manufacturing, or evaluating efficiencies.
Q3: Stagflation occurs when<br>A)inflation rises and nominal GDP
Q4: Which of the following is not a
Q63: If planned investment is equal to actual
Q157: What is potential GDP?<br>A)It is the level
Q172: Refer to Figure 9.1.Ceteris paribus, an increase
Q219: A decrease in the real interest rate
Q242: Which of the following is a reason
Q269: Commodity money is a good<br>A)used as money
Q280: If banks receive a greater amount of
Q304: Suppose Canada experiences a long period of