Figure 9.6 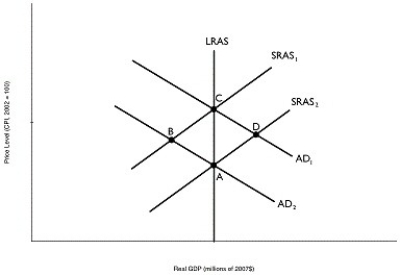 Alt text for Figure 9.6: In figure 9.6, a graph depicting short-run equilibrium and long-run equilibrium.
Long description for Figure 9.6: The x-axis is labelled, real GDP (trillions of 2007 dollars) , and the y-axis is labelled, price level (CPI) .5 lines are shown; SRAS1, SRAS2, AD1, AD2, and LRAS.Line SRAS1 begins near the bottom left and slopes up to the top right corner.Line SRAS2 follows the same slope as line SRAS1, but is plotted to the right.Line AD1 begins at the top left corner and slopes down to the bottom center.Line AD2 follows the same slope as AD1, but is plotted to the right.Line SRAS1 intersects line AD1 at point C, more than half way along both lines.Line SRAS1 intersects line AD2 at point B, approximately 3 quarters of the way along both lines.Line SRAS2 intersects line AD1 at point D, approximately 3 quarters of the way along both lines.Line SRAS2 intersects the line AD2 at point A, more than half way along both lines.Line LRAS is perpendicular to the x-axis, passing through points A and C and intersecting all 4 lines.
-Refer to Figure 9.6.Which of the points in the above graph are possible short-run equilibria?
Definitions:
Q13: If the desired reserve ratio is 10
Q25: The largest proportion of M1+ is made
Q85: A person's wealth<br>A)is a measure of how
Q122: Banks hold 100% of their chequing deposits
Q128: Hyperinflation is caused by<br>A)a constant increase in
Q131: There is a strong link between changes
Q181: The automatic mechanism _ the price level
Q202: An increase in the real interest rate
Q205: Consumption is $5 million, planned investment spending
Q235: Canada followed the U.S.into recession in 2008,