Figure 9.6 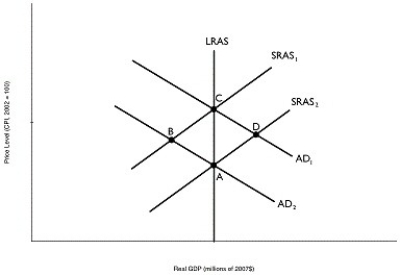 Alt text for Figure 9.6: In figure 9.6, a graph depicting short-run equilibrium and long-run equilibrium.
Long description for Figure 9.6: The x-axis is labelled, real GDP (trillions of 2007 dollars) , and the y-axis is labelled, price level (CPI) .5 lines are shown; SRAS1, SRAS2, AD1, AD2, and LRAS.Line SRAS1 begins near the bottom left and slopes up to the top right corner.Line SRAS2 follows the same slope as line SRAS1, but is plotted to the right.Line AD1 begins at the top left corner and slopes down to the bottom center.Line AD2 follows the same slope as AD1, but is plotted to the right.Line SRAS1 intersects line AD1 at point C, more than half way along both lines.Line SRAS1 intersects line AD2 at point B, approximately 3 quarters of the way along both lines.Line SRAS2 intersects line AD1 at point D, approximately 3 quarters of the way along both lines.Line SRAS2 intersects the line AD2 at point A, more than half way along both lines.Line LRAS is perpendicular to the x-axis, passing through points A and C and intersecting all 4 lines.
-Refer to Figure 9.6.Suppose the economy is at point C.If investment spending decreases in the economy, where will the eventual long-run equilibrium be?
Definitions:
Internet News
News and information distributed and accessed through the internet, encompassing a wide range of digital platforms.
Circulation Numbers
The total quantity of copies of a publication (such as a newspaper or a magazine) distributed in a given period.
Average Fixed Costs
Average fixed costs are calculated by dividing the total fixed costs by the quantity of output produced, showing cost per unit.
MC Curves
Marginal Cost Curves, which illustrate how the cost of producing one additional unit of a good varies as the quantity of production changes.
Q14: Refer to Figure 9.3.Ceteris paribus, an increase
Q58: The long-run aggregate supply curve is vertical.
Q88: Dollar coins (loonies)in the modern economy serve
Q130: The two main monetary policy tools used
Q144: Refer to Figure 11.10.In the figure above,
Q159: In the aggregate expenditure model, _ has
Q175: Inventories refer to<br>A)goods which have been presold
Q227: The bank rate is<br>A)the rate at which
Q274: If the Bank of Canada wishes to
Q276: M2 includes currency held outside banks plus<br>A)currency