Figure 9.7 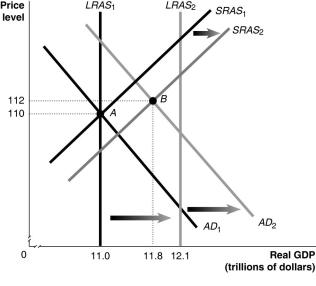 Alt text for Figure 9.7: In figure 9.7, a graph comparing real GDP and price level.
Long description for Figure 9.7: The x-axis is labelled, real GDP (trillions of dollars) , with values 11.0, 11.8, 12.1 marked.The y-axis is labelled, price level, with values 110 and 112 marked.6 lines are shown; SRAS1, SRAS2, AD1, AD2, LRAS1, LRAS2.Line SRAS1 begins near the bottom left and slopes up to the top right corner.Line SRAS2 follows the same slope as line SRAS1, but is plotted to the right.The area between lines SRAS1 and SRAS2 is indicated by a right pointing arrow.Line AD1 begins at the top left corner and slopes down toward the bottom center.Line AD2 follows the same slope as AD1, but is plotted to the right.The area between lines AD1 and AD2 is indicated by a right pointing arrow.Line LRAS1 is perpendicular to the x-axis, and begins from value 11.0.Line LRAS2 perpendicular to the x-axis, and begins from point 12.1.The area between lines LRAS1 and LRAS2 is indicated by a right pointing arrow.Line LRAS1 intersects lines AD1 and SRAS1 at point A (11.0, 110) .Lines AD2 and SRAS2 intersect at point B (11.8, 112) .Points A and B are connected to their respective coordinates on the x-axis and y-axis with dotted lines.Line LRAS2 intersects lines SRAS1 and SRAS2 on the right end of these lines.Similarly, line LRAS2 intersects lines AD1 and AD2 on the right end of these lines.
-Refer to Figure 9.7.In the figure above, LRAS1 and SRAS1 denote LRAS and SRAS in year 1, while LRAS2 and SRAS2 denote LRAS and SRAS in year 2.Given the economy is at point A in year 1, what is the growth rate in potential GDP in year 2?
Definitions:
Lanugo
Fine, soft hair, especially that which covers the body and limbs of a human fetus or newborn.
Dark Hair
A physical characteristic referring to the presence of higher levels of melanin in the hair, resulting in shades ranging from brown to black.
Fuzzy Coat
A term that may refer to an animal's fur that is soft, fluffy, and thick, providing insulation and protection.
Newborn Daughter
Refers to a female child at the earliest stage of life, particularly within the first hours to weeks of being born.
Q9: Spending on the military is essentially categorized
Q18: Why does the short-run aggregate supply curve
Q46: The five most important variables that determine
Q47: Lower personal income taxes<br>A)increase aggregate demand.<br>B)decrease disposable
Q58: If the marginal propensity to save is
Q106: A bank's liabilities are<br>A)things owned by or
Q141: Refer to Figure 9.3.Ceteris paribus, an increase
Q225: Refer to Figure 9.5.Suppose the economy is
Q241: What impact does a lower price level
Q257: The Bank of Canada can use expansionary