Figure 9.7 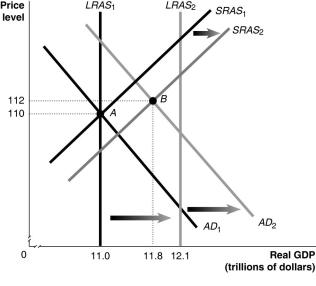 Alt text for Figure 9.7: In figure 9.7, a graph comparing real GDP and price level.
Long description for Figure 9.7: The x-axis is labelled, real GDP (trillions of dollars) , with values 11.0, 11.8, 12.1 marked.The y-axis is labelled, price level, with values 110 and 112 marked.6 lines are shown; SRAS1, SRAS2, AD1, AD2, LRAS1, LRAS2.Line SRAS1 begins near the bottom left and slopes up to the top right corner.Line SRAS2 follows the same slope as line SRAS1, but is plotted to the right.The area between lines SRAS1 and SRAS2 is indicated by a right pointing arrow.Line AD1 begins at the top left corner and slopes down toward the bottom center.Line AD2 follows the same slope as AD1, but is plotted to the right.The area between lines AD1 and AD2 is indicated by a right pointing arrow.Line LRAS1 is perpendicular to the x-axis, and begins from value 11.0.Line LRAS2 perpendicular to the x-axis, and begins from point 12.1.The area between lines LRAS1 and LRAS2 is indicated by a right pointing arrow.Line LRAS1 intersects lines AD1 and SRAS1 at point A (11.0, 110) .Lines AD2 and SRAS2 intersect at point B (11.8, 112) .Points A and B are connected to their respective coordinates on the x-axis and y-axis with dotted lines.Line LRAS2 intersects lines SRAS1 and SRAS2 on the right end of these lines.Similarly, line LRAS2 intersects lines AD1 and AD2 on the right end of these lines.
-Refer to Figure 9.7.Given the economy is at point A in year 1, what will happen to the unemployment rate in year 2?
Definitions:
Cochlea
A spiral-shaped, fluid-filled inner ear structure essential for converting sound waves into electrical impulses for hearing.
Eardrum
The Eardrum, or tympanic membrane, is a thin, cone-shaped membrane that separates the external ear from the middle ear and vibrates in response to sound waves.
Bipolar Cell
A type of neuron found in the eye's retina, serving as an intermediate layer between photoreceptor cells and ganglion cells, and playing a significant role in visual processing.
Rods
Retinal receptors that detect black, white, and gray, and are sensitive to movement; necessary for peripheral and twilight vision, when cones don’t respond.
Q7: The _ curve has a positive slope
Q16: Suppose that the bank has the following
Q34: A central bank can help stop a
Q53: Your roommate is having trouble grasping how
Q90: A general formula for the multiplier is<br>A)
Q98: A decrease in the price level will<br>A)shift
Q113: Refer to Figure 11.8.In the figure above,
Q149: The level of aggregate supply in the
Q216: Suppose a transaction changes a bank's balance
Q315: If planned aggregate expenditure is greater than