Figure 9.8 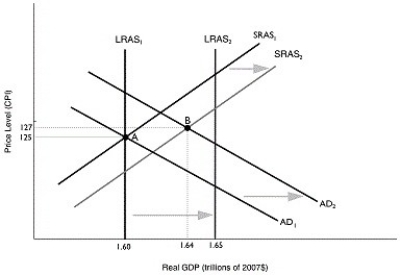 Alt text for Figure 9.8: In figure 9.8, a graph comparing real GDP and price level.
Long description for Figure 9.8: The x-axis is labelled, real GDP (trillions of dollars) , with values 1.60, 1.64, 1.65 marked.The y-axis is labelled, price level (CPI) , with values 125 and 127 marked.6 lines are shown; SRAS1, SRAS2, AD1, AD2, LRAS1, LRAS2.Line SRAS1 begins in the bottom left corner and slopes up to the top right corner.Line SRAS2 follows the same slope as line SRAS1, but is plotted to the right.The area between lines SRAS1 and SRAS2 is indicated by a right pointing arrow.Line AD1 begins at the top left corner and slopes down to the bottom center.Line AD2 follows the same slope as line AD1, but is plotted to the right.The area between lines AD1 and AD2 is indicated by a right pointing arrow.Line LRAS1 is perpendicular to the x-axis, and begins from the value 1.60.Line LRAS2 is perpendicular to the x-axis, and begins from the value 1.65.The area between lines LRAS1 and LRAS2 is indicated by a right pointing arrow.Line LRAS1 intersects lines AD1 and SRAS1 at point A (1.60, 125) .Lines AD2 and SRAS2 intersect at point B (1.64, 127) .Points A and B are connected to their respective coordinates on the x-axis and y-axis with dotted lines.Line LRAS2 intersects lines SRAS1 and SRAS2 near the right end of these lines.Similarly, line LRAS2 intersects lines AD1 and AD2 near the right end of these lines.
-Refer to Figure 9.8.Given the economy is at point A in year 1, the unemployment rate will ________ and the price level will ________ in year 2.
Definitions:
Childhood Cognition
The development and functioning of thinking and understanding in children, including learning, memory, problem-solving, and decision-making skills.
Animal Intelligence
encompasses the cognitive abilities of animals, including learning, problem-solving, memory, and understanding of their environment.
Public Transportation
Public transportation refers to systems of conveyance provided by or on behalf of governmental bodies to move people within a community or region, including buses, trains, and subways.
Consecutive Hours
A sequence of hours that follow one another without interruption, often used to measure the duration of activities or operations from start to finish.
Q34: A central bank can help stop a
Q46: An increase in the overnight interest rate
Q74: The decrease in consumer spending during the
Q96: The difference between GDP and net taxes
Q149: Suppose you withdraw $1,000 in cash from
Q187: Aggregate expenditure includes consumption spending, planned investment
Q204: What are the five main determinants of
Q205: When the price level rises from 110
Q248: Which of the following is the most
Q251: Explain how a stock market crash has