Figure 9.6 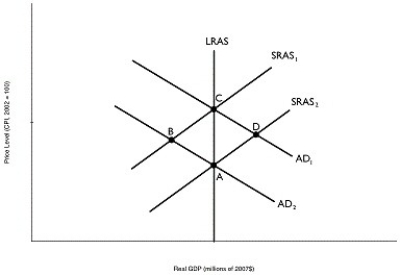 Alt text for Figure 9.6: In figure 9.6, a graph depicting short-run equilibrium and long-run equilibrium.
Long description for Figure 9.6: The x-axis is labelled, real GDP (trillions of 2007 dollars) , and the y-axis is labelled, price level (CPI) .5 lines are shown; SRAS1, SRAS2, AD1, AD2, and LRAS.Line SRAS1 begins near the bottom left and slopes up to the top right corner.Line SRAS2 follows the same slope as line SRAS1, but is plotted to the right.Line AD1 begins at the top left corner and slopes down to the bottom center.Line AD2 follows the same slope as AD1, but is plotted to the right.Line SRAS1 intersects line AD1 at point C, more than half way along both lines.Line SRAS1 intersects line AD2 at point B, approximately 3 quarters of the way along both lines.Line SRAS2 intersects line AD1 at point D, approximately 3 quarters of the way along both lines.Line SRAS2 intersects the line AD2 at point A, more than half way along both lines.Line LRAS is perpendicular to the x-axis, passing through points A and C and intersecting all 4 lines.
-Refer to Figure 9.6.Which of the points in the above graph are possible long-run equilibria?
Definitions:
Accounting Profit
The difference between a firm's total revenue and its explicit costs, often reported in the financial statements.
Economic Profit
The difference between total revenue and total costs, including both explicit and implicit costs, representing the true profitability of a company.
Accounting Profit
The difference between the total revenue received from sales and the total explicit costs of a business.
Explicit Costs
Direct payments made to others in the course of running a business, such as wages, rent, and materials.
Q31: Suppose you withdraw $1,000 from your savings
Q77: In response to already low interest rates
Q106: An increase in aggregate demand in the
Q112: Use the money demand and money supply
Q117: Which of the following is a true
Q196: Long-run macroeconomic equilibrium occurs when aggregate demand
Q202: An increase in the real interest rate
Q233: Investment spending will decrease when<br>A)the interest rate
Q267: Refer to Figure 11.3.In the figure above,
Q274: If an increase in investment spending of