Figure 9.8 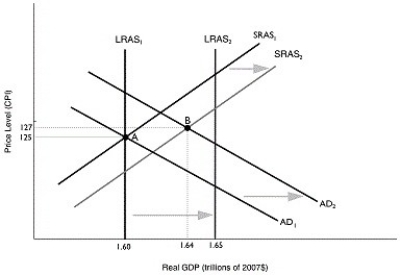 Alt text for Figure 9.8: In figure 9.8, a graph comparing real GDP and price level.
Long description for Figure 9.8: The x-axis is labelled, real GDP (trillions of dollars) , with values 1.60, 1.64, 1.65 marked.The y-axis is labelled, price level (CPI) , with values 125 and 127 marked.6 lines are shown; SRAS1, SRAS2, AD1, AD2, LRAS1, LRAS2.Line SRAS1 begins in the bottom left corner and slopes up to the top right corner.Line SRAS2 follows the same slope as line SRAS1, but is plotted to the right.The area between lines SRAS1 and SRAS2 is indicated by a right pointing arrow.Line AD1 begins at the top left corner and slopes down to the bottom center.Line AD2 follows the same slope as line AD1, but is plotted to the right.The area between lines AD1 and AD2 is indicated by a right pointing arrow.Line LRAS1 is perpendicular to the x-axis, and begins from the value 1.60.Line LRAS2 is perpendicular to the x-axis, and begins from the value 1.65.The area between lines LRAS1 and LRAS2 is indicated by a right pointing arrow.Line LRAS1 intersects lines AD1 and SRAS1 at point A (1.60, 125) .Lines AD2 and SRAS2 intersect at point B (1.64, 127) .Points A and B are connected to their respective coordinates on the x-axis and y-axis with dotted lines.Line LRAS2 intersects lines SRAS1 and SRAS2 near the right end of these lines.Similarly, line LRAS2 intersects lines AD1 and AD2 near the right end of these lines.
-Refer to Figure 9.8.In the figure above, AD1, LRAS1, and SRAS1 denote AD, LRAS ,and SRAS in year 1, while AD2, LRAS2, and SRAS2 denote AD, LRAS, and SRAS in year 2.Given the economy is at point A in year 1, what is the actual growth rate in GDP in year 2?
Definitions:
Q19: For the purchasing power of money to
Q87: Liquidity increases as we move from the
Q107: Ceteris paribus, how does an expansion in
Q107: Maintaining a strong dollar in international currency
Q118: In the long run,<br>A)GDP > potential GDP.<br>B)unemployment
Q135: Workers expect inflation to rise from 3%
Q166: The level of real GDP in the
Q179: A decrease in the price level in
Q186: Refer to Table 11.4.Consider the hypothetical information
Q190: An economy is likely to recover from