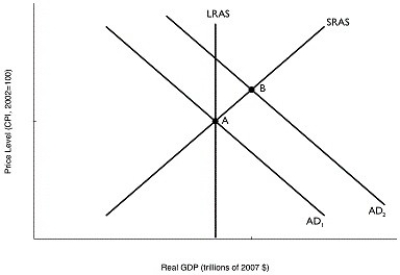
Figure 11.12  Alt text for Figure 11.12: In figure 11.12, a graph comparing real GDP and price level.
Long description for Figure 11.12: The x-axis is labelled, real GDP (trillions of 2007 dollars) and the y-axis is labelled, price level (CPI, 2002 = 100) .4 lines are shown; AD1, AD2, LRAS, SRAS.Line AD1 begins in the top left corner and slopes down to the end of the x-axis.Line AD2 follows the same slope but is plotted to the right.Line SRAS begins in the bottom left corner and slopes up to the top right corner.Line LRAS is perpendicular to the x-axis, and intersects lines AD1 and SRAS at point A.Lines AD2 and SRAS intersect at point B.
-Refer to Figure 11.12.In the figure above, suppose the economy is initially at point A.The movement of the economy to point B as shown in the graph illustrates the effect of which of the following policy actions by the Bank of Canada?
Definitions:
Common Stock
A type of security that represents ownership in a corporation, granting holders voting rights and a share in the company's profits through dividends.
Accounting Services
Professional services related to the maintenance and auditing of financial records and preparation of financial reports.
Advertising Expense
This refers to the costs a business incurs for marketing and promoting its products or services.
Common Stock
A type of equity security that represents ownership in a corporation, with holders possibly entitled to vote on corporate matters and receive dividends.
Q54: The monetary policy target the Bank of
Q69: Employees at the university have negotiated a
Q69: If the rate of growth in real
Q86: Changes in the overnight interest rate usually
Q106: An increase in aggregate demand in the
Q133: If money demand is extremely sensitive to
Q152: When people became less concerned with the
Q242: A cash withdrawal from the banking system<br>A)decreases
Q244: In recent years, a monetary growth rule
Q271: In the 2015 federal election campaign the