Figure 11.13 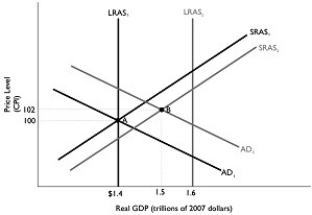 Alt text for Figure 11.13: In figure 11.13, a dynamic model of AD-AS.
Long description for Figure 11.13: The x-axis is labelled, real GDP (trillions of 2007 dollars) , with values $1.4, 1.5, 1.6 marked.The y-axis is labelled, price level (CPI) , with values 100 and 102 marked.6 lines are shown; SRAS1, SRAS2, AD1, AD2, LRAS1, LRAS2.Line SRAS1 begins in the bottom left and slopes up to the top right corner.Line SRAS2 follows the same slope as line SRAS1, but is plotted to the right.Line AD1 begins at the top left corner and slopes down to the end of the x-axis.Line AD2 follows the same slope as AD1, but is plotted to the right.Line LRAS1 is perpendicular to the x-axis, and begins from the x-axis value $1.4.Line LRAS2 is perpendicular to the x-axis, and begins from the value 1.6.Line LRAS1 intersects line AD1 and SRAS1 at point A ($1.4, 100) .Lines AD2 and SRAS2 intersect at point B (1.5, 102) .Points A and B are connected to their respective coordinates on the x-axis and y-axis with dotted lines.Line LRAS2 intersects lines SRAS1 and SRAS2 on the right end of these lines.Similarly, line LRAS2 intersects lines AD1 and AD2 toward the right end of these lines.
-Refer to Figure 11.13.In the dynamic model of AD-AS in the figure above, if the economy is at point A in year 1 and is expected to go to point B in year 2, the Bank of Canada would most likely
Definitions:
Preemptive Rights
The right of existing shareholders to maintain their fractional ownership of a company by buying a proportional number of shares of any future issue of common stock.
Proportionate Share
An individual's or entity's fair or equitable share of something, such as profits, losses, or ownership, based on their contribution or stake.
Lead Investment Bank
A financial institution that coordinates the initial public offering (IPO) process, including underwriting, setting share prices, and marketing the shares.
Open Market
A marketplace that is accessible to both buyers and sellers where securities, commodities, and goods are traded freely.
Q15: What is the natural rate of unemployment?<br>A)the
Q31: Suppose you withdraw $1,000 from your savings
Q46: An increase in the overnight interest rate
Q48: If people speculate that a run on
Q112: An appropriate fiscal policy response when aggregate
Q179: How could the existence of an employment
Q182: Why would businesses watch the bank of
Q200: Credit card balances are<br>A)part of M1+.<br>B)part of
Q210: The multiplier effect following an increase in
Q249: If the Bank of Canada pursues expansionary