Figure 11.14 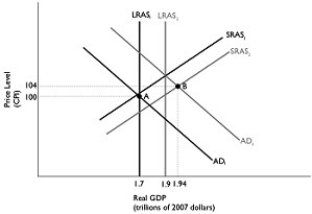 Alt text for Figure 11.14: In figure 11.14, a dynamic AD-AS model.
Long description for Figure 11.14: The x-axis is labelled, real GDP (trillions of 2007 dollars) .The y-axis is labelled, price level (CPI) .6 lines are shown; SRAS1, SRAS2, AD1, AD2, LRAS1, and LRAS2.Line SRAS1 begins near the bottom left corner and slopes up to the top right corner.Line SRAS2 follows the same slope as line SRAS1, but is plotted to the right.Line AD1 begins at the top left corner and slopes down to the end of the x-axis.Line AD2 follows the same slope as line AD1, but is plotted to the right.Line LRAS1 is perpendicular to the x-axis and begins from x-axis value 1.7.Line LRAS2 is perpendicular to the x-axis and begins from x-axis value 1.9.Line LRAS1 intersects lines AD1 and SRAS1 at point A (1.7, 100) .Lines AD2 and SRAS2 intersect at point B (1.94, 104) .Points A and B are connected to their respective coordinates on the x-axis and y-axis with dotted lines.Line LRAS1 intersects line SRAS2 below point A.Line LRAS2 intersects lines SRAS1 and AD2 just above point B.
-Refer to Figure 11.14.In the dynamic AD-AS model, if the economy is at point A in year 1 and is expected to go to point B in year 2, and the Bank of Canada pursues no policy, then at point B
Definitions:
Independent Variable
In experimentation or statistical analysis, the variable that is manipulated or changed to observe its effects on the dependent variable.
Dependent Variable
In statistical and mathematical analysis, the variable whose value is subject to the influence of another variable.
Horizontal Axis
In graphs and charts, this axis typically represents the independent variable or time period under examination.
Vertical Axis
The “up-down” or “north-south” measurement line on a graph or grid.
Q24: With the Troubled Asset Relief Program (TARP),
Q32: The only way money can be removed
Q37: Suppose that the desired reserve ratio is
Q94: Calculate the value of the government purchases
Q110: Economies cannot function without money.
Q119: If the economy is growing beyond potential
Q137: When a government has a budget deficit,
Q153: Refer to Figure 11.1.In the figure, the
Q243: How can tax simplification be beneficial to
Q302: What is the difference between fiscal policy