Figure 11.14 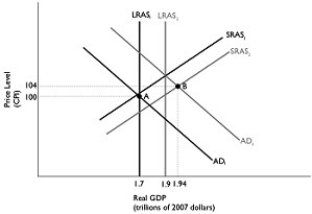 Alt text for Figure 11.14: In figure 11.14, a dynamic AD-AS model.
Long description for Figure 11.14: The x-axis is labelled, real GDP (trillions of 2007 dollars) .The y-axis is labelled, price level (CPI) .6 lines are shown; SRAS1, SRAS2, AD1, AD2, LRAS1, and LRAS2.Line SRAS1 begins near the bottom left corner and slopes up to the top right corner.Line SRAS2 follows the same slope as line SRAS1, but is plotted to the right.Line AD1 begins at the top left corner and slopes down to the end of the x-axis.Line AD2 follows the same slope as line AD1, but is plotted to the right.Line LRAS1 is perpendicular to the x-axis and begins from x-axis value 1.7.Line LRAS2 is perpendicular to the x-axis and begins from x-axis value 1.9.Line LRAS1 intersects lines AD1 and SRAS1 at point A (1.7, 100) .Lines AD2 and SRAS2 intersect at point B (1.94, 104) .Points A and B are connected to their respective coordinates on the x-axis and y-axis with dotted lines.Line LRAS1 intersects line SRAS2 below point A.Line LRAS2 intersects lines SRAS1 and AD2 just above point B.
-Refer to Figure 11.14.In the dynamic AD-AS model, the economy is at point A in year 1 and is expected to go to point B in year 2, and the Bank of Canada pursues the appropriate policy.This will result in
Definitions:
Portfolio Analysis
The evaluation of the performance and composition of a collection of investments, projects, or products to make strategic decisions.
Spend Map
A tool or document used in procurement and supply chain management to visualize and analyze an organization's spending patterns, helping with strategic planning and savings identification.
Item Substitution
The practice of replacing one item with another, typically similar item, often due to availability issues or cost benefits.
Environmental Strategies
Approaches adopted by businesses to minimize their ecological footprint and enhance sustainability through processes, products, or services.
Q18: The Bank of Canada's two main monetary
Q46: An increase in the overnight interest rate
Q59: To evaluate the size of the federal
Q66: Calculate the government purchases multiplier if the
Q84: The Bank of Canada can directly lower
Q88: Dollar coins (loonies)in the modern economy serve
Q121: Changes in interest rates affect all four
Q152: In 2009, the federal government introduced Canada's
Q168: Refer to Table 11.5.Consider the hypothetical information
Q180: An increase in the money supply is