Figure 11.13 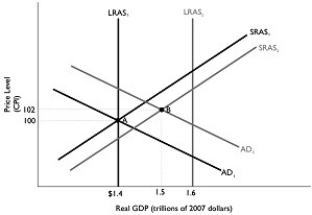 Alt text for Figure 11.13: In figure 11.13, a dynamic model of AD-AS.
Long description for Figure 11.13: The x-axis is labelled, real GDP (trillions of 2007 dollars) , with values $1.4, 1.5, 1.6 marked.The y-axis is labelled, price level (CPI) , with values 100 and 102 marked.6 lines are shown; SRAS1, SRAS2, AD1, AD2, LRAS1, LRAS2.Line SRAS1 begins in the bottom left and slopes up to the top right corner.Line SRAS2 follows the same slope as line SRAS1, but is plotted to the right.Line AD1 begins at the top left corner and slopes down to the end of the x-axis.Line AD2 follows the same slope as AD1, but is plotted to the right.Line LRAS1 is perpendicular to the x-axis, and begins from the x-axis value $1.4.Line LRAS2 is perpendicular to the x-axis, and begins from the value 1.6.Line LRAS1 intersects line AD1 and SRAS1 at point A ($1.4, 100) .Lines AD2 and SRAS2 intersect at point B (1.5, 102) .Points A and B are connected to their respective coordinates on the x-axis and y-axis with dotted lines.Line LRAS2 intersects lines SRAS1 and SRAS2 on the right end of these lines.Similarly, line LRAS2 intersects lines AD1 and AD2 toward the right end of these lines.
-Refer to Figure 11.13.In the dynamic model of AD-AS in the figure above, the economy is at point A in year 1 and is expected to go to point B in year 2, and the Bank of Canada pursues the appropriate policy.This will result in
Definitions:
Unemployment
The situation in which individuals who are capable of working are actively seeking work but are unable to find employment.
Cyclical
Pertaining to fluctuations in economic activity occurring due to the natural business cycle, including expansions, peaks, recessions, and troughs.
Structural
Relating to the underlying or fundamental aspects of something, especially with regard to economic sectors or market changes.
Aggregate Supply Curve
A graphical representation showing the total quantity of goods and services that producers are willing and able to supply at different price levels in an economy.
Q22: Which of the following is not a
Q39: How is the quantity theory of money
Q44: Which of the following statements regarding the
Q66: In the countries that have adopted inflation
Q107: Lowering the overnight interest rate will<br>A)decrease reserves,
Q117: Gretchen expects the price level to rise
Q192: In absolute value, the tax multiplier is
Q210: In the long run,<br>A)total unemployment = frictional
Q214: Under the monetary growth rule proposed by
Q251: An increase in government spending may expedite