Figure 11.14 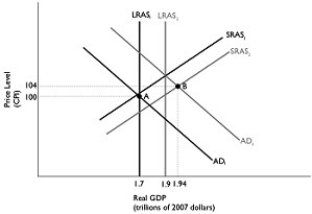 Alt text for Figure 11.14: In figure 11.14, a dynamic AD-AS model.
Long description for Figure 11.14: The x-axis is labelled, real GDP (trillions of 2007 dollars) .The y-axis is labelled, price level (CPI) .6 lines are shown; SRAS1, SRAS2, AD1, AD2, LRAS1, and LRAS2.Line SRAS1 begins near the bottom left corner and slopes up to the top right corner.Line SRAS2 follows the same slope as line SRAS1, but is plotted to the right.Line AD1 begins at the top left corner and slopes down to the end of the x-axis.Line AD2 follows the same slope as line AD1, but is plotted to the right.Line LRAS1 is perpendicular to the x-axis and begins from x-axis value 1.7.Line LRAS2 is perpendicular to the x-axis and begins from x-axis value 1.9.Line LRAS1 intersects lines AD1 and SRAS1 at point A (1.7, 100) .Lines AD2 and SRAS2 intersect at point B (1.94, 104) .Points A and B are connected to their respective coordinates on the x-axis and y-axis with dotted lines.Line LRAS1 intersects line SRAS2 below point A.Line LRAS2 intersects lines SRAS1 and AD2 just above point B.
-Refer to Figure 11.14.In the dynamic AD-AS model, if the economy is at point A in year 1 and is expected to go to point B in year 2, and the Bank of Canada pursues no policy, then at point B
Definitions:
Conflict
A situation or period of struggle or disagreement between people with opposing needs, beliefs, or interests.
Prolonged Period
Refers to a time span that extends longer than usual or expected.
Rousseau
Jean-Jacques Rousseau, a Genevan philosopher, writer, and composer of the 18th century, known for his influential thoughts on education and social contract theory.
Hobbes
An English philosopher, best known for his political philosophy that includes the social contract theory found in his work "Leviathan."
Q27: In the dynamic aggregate demand and aggregate
Q131: There is a strong link between changes
Q144: Refer to Figure 11.10.In the figure above,
Q146: Contractionary fiscal policy to prevent real GDP
Q175: The Bank of Canada is overseen by
Q176: If the Phillips curve represents a "_
Q200: Parliament carries out fiscal policy through changes
Q205: Which of the following is not one
Q226: The price level in the economy between
Q251: What are the four functions of money?