Figure 12.8 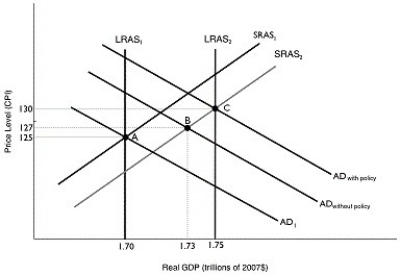 Alt text for Figure 12.8: In figure 12.8, a graph comparing real GDP and price level.
Long description for Figure 12.8: The x-axis is labelled, real GDP (trillions of 2007 dollars) .The y-axis is labelled, price level (CPI) .7 lines are shown; SRAS1, SRAS2, AD1, AD without policy, AD with policy, LRAS1, and LRAS2.Line SRAS1 begins in the bottom left corner and slopes up to the top right corner.Line SRAS2 follows the same slope as line SRAS1, but is plotted to the right.Line AD1 begins at the top left corner and slopes down to the end of the x-axis.Lines AD without policy, and AD with policy, follow the same slope as line AD1, but are plotted to the right.Line LRAS1 is perpendicular to the x-axis, and begins from the x-axis value 1.70.Line LRAS2 is perpendicular to the x-axis, and begins from the x-axis value 1.75, to the right of line LRAS1.Line LRAS1 intersects lines AD1 and SRAS1 at point A (1.70, 125) .Lines AD without policy, and SRAS2 intersect at point B (1.73, 127) .Line LRAS2 intersects the lines AD with policy, and SRAS2 at point C (1.75, 130) .
-Refer to Figure 12.8.In the graph above, suppose the economy in Year 1 is at point A and expected in Year 2 to be at point B.Which of the following policies could the federal government use to move the economy to point C?
Definitions:
Q23: What actions could the Bank of Canada
Q24: Why would a higher tax rate lower
Q43: When the Bank of Canada decreases the
Q104: Assume weak growth in aggregate demand keeps
Q106: Real business cycle models argue that fluctuations
Q157: Which of the following would increase the
Q190: How will the purchase of $100 million
Q238: If the amount you owe on your
Q243: With a monetary growth rule as proposed
Q253: The purchase of $1 million of government