Figure 12.13 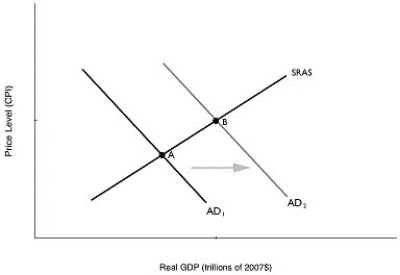 Alt text for Figure 12.13: In figure 12.13, a graph depicting the shift in aggregate demand.
Long description for Figure 12.13: The x-axis is labelled, real GDP (trillions of 2007 dollars) , and the y-axis is labelled, price level (CPI) .3 lines are shown; AD1, AD2, and SRAS.Line AD1 begins at the top left corner and slopes down to the bottom center.Line AD2 follows the same slope as line AD1, but is plotted to the right.The area between lines AD1 and AD2 is indicated by a right pointing arrow.Line SRAS intersects line AD1 at point A, more than half way along line AD1.Line SRAS intersects line AD2 at point B, less than half way along line AD2.
-Refer to Figure 12.13.An increase in government purchases of $20 billion causes aggregate demand to shift ultimately from AD1 to AD2.The difference in real GDP between point A and point B will be ________ $20 billion.
Definitions:
Real Interest Rate
The interest rate adjusted for inflation, reflecting the true cost of borrowing and the true yield on investments.
Capitalist Income
The total earnings received by capital owners in an economy, including profits, rents, interest, and dividends.
Corporate Profits
The earnings of a corporation after all expenses have been deducted from revenues, indicating the financial success of the company.
Resource Suppliers
Entities or individuals that provide essential inputs or resources required for production processes across various industries.
Q46: During recessions, government expenditure automatically<br>A)falls because of
Q85: Which of the following is an appropriate
Q106: When the Bank of Canada increases the
Q156: Since 1965, the largest federal budget deficit
Q185: Refer to Figure 11.2.In the figure above,
Q195: If Ontarians increase their purchases of Italian
Q216: Following a decrease in government spending, as
Q246: A financial asset is considered _ if
Q249: If the Bank of Canada pursues expansionary
Q265: Refer to Table 12.6.The economy is in