Figure 13.1 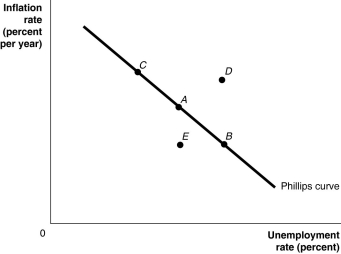 Alt text for Figure 13.1: In figure 13.1, a short-run Phillips curve.
Long description for Figure 13.1: The x-axis is labelled, unemployment rate percent, and the y-axis is labelled, inflation rate percent per year.A straight line labelled, Philips curve, begins at the top left corner and slopes down to the end of the x-axis.Point A is plotted half way along line Philips curve.Point B is plotted to the right of point A and point C is plotted is to the left of point A.Point D is plotted above this line, in the left center of the quadrant.Point E is plotted below this line, directly below point A.
-Refer to Figure 13.1.What should the Bank of Canada do if it wants to move from point A to point C in the short-run Phillips curve depicted in the figure above?
Definitions:
Display Rules
Socially and culturally learned norms that dictate the appropriate emotional responses in various situations.
Informal Standards
Unwritten but understood rules and expectations that influence behavior and practices within a group or organization.
Different Cultures
Refers to the variety of lifestyles, traditions, and beliefs held by groups of people from different backgrounds.
Personality
The combination of characteristics or qualities that form an individual's distinctive character, influencing behavior and interactions.
Q46: During recessions, government expenditure automatically<br>A)falls because of
Q77: Assume your marginal income tax rate is
Q132: Which of the following would result in
Q143: Describe the differences (in sign and relative
Q162: Increasing the federal budget deficit will contribute
Q194: Refer to Figure 14.3.Consider the market for
Q207: The expansionary monetary and fiscal policies of
Q234: Ceteris paribus, an increase in the government's
Q272: The federal government increased income tax deductions
Q289: The government budget for the country of