Figure 13.5 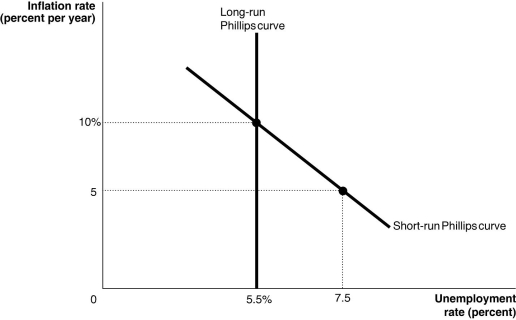 Alt text for Figure 13.5: In figure 13.5, a graph shows the short-run and long-run Phillips curves.
Long description for Figure 13.5: The x-axis is labelled, unemployment rate percent.The y-axis is labelled, inflation rate percent per year.A straight line labelled, short-run Philips Curve, begins at the top left corner and slopes down to the end of the x-axis.A straight line labelled, long-run Philips Curve is perpendicular to the x-axis, and begins from the x-axis value 5.5%.Long-run Philips Curve intersects the short-run Philips Curve at point (5.5%, 10%) .A point (7.5, 5) is plotted near the right end of the short-run Philips Curve.The points are connected to their respective coordinates on the x and y-axes with dotted lines.
-Refer to Figure 13.5.Consider the Phillips curves shown in the above graph.We can conclude from this graph that
Definitions:
Sensing
The process of receiving information through physical senses to understand and interact with the environment.
Judging
The process of forming an opinion or conclusion about something or someone, often based on information and reasoning.
Evaluative Beliefs
Evaluative beliefs are judgments or assessments about objects, persons, or events that reflect an individual's values and experiences.
Person-Organization Value Congruence
The degree to which an individual's values, goals, and beliefs align with the culture and values of the organization they work for.
Q14: Evidence shows that for many people, delaying
Q41: If there is currently a surplus of
Q58: A decrease in the marginal income tax
Q89: If people assume that future rates of
Q136: According to the short-run Phillips curve, which
Q147: Refer to Figure 13.2.Suppose the economy is
Q193: In what year was the Bretton Woods
Q194: Firms that participate in regular open market
Q194: The key to understanding the short-run trade-off
Q233: Expansionary fiscal policy is used to increase