Figure 13.10 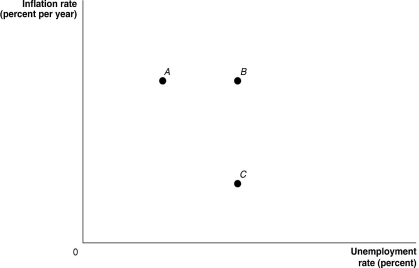 Alt text for Figure 13.10: In figure 13.10, a graph comparing unemployment rate and inflation rate.
Long description for Figure 13.10: The x-axis is labelled, unemployment rate percent, and the y-axis is labelled, inflation rate percent per year.3 points; A, B, and C are plotted such that A and B share equivalent y-axis values, and B and C share equivalent x-axis values.
-Refer to Figure 13.10.A response to persistent ________ due to ongoing expansionary monetary policy is depicted in the figure above as a movement from C to A to B.
Definitions:
Q1: If the exchange rate between the Canadian
Q4: Refer to Figure 13.10.A typical long-run Phillips
Q25: Ceteris paribus, in the short run following
Q31: The 1989-1993 Bank of Canada adoption of
Q53: Contractionary fiscal policy involves decreasing government purchases
Q79: Refer to Figure 13.7.Consider the Phillips curves
Q122: Suppose the federal government increases taxes by
Q141: Crowding out refers to a decrease in
Q158: How were exchange rates determined under the
Q159: As the tax wedge associated with a