Figure 14.1 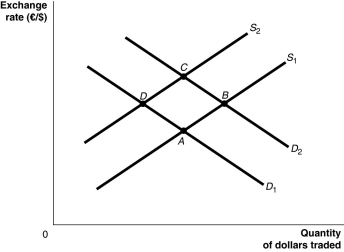 Alt text for Figure 14.1: In figure 14.1, a graph illustrates the quantity of dollars traded against the exchange rate.
Long description for Figure 14.1: The x-axis is labelled, quantity of dollars traded, and the y-axis is labelled, exchange rate, euros against dollars.2 supply curves; S1 and S2, and two demand curves; D1 and D2 are plotted.Supply curve S1 is a straight line which slopes up from the bottom left corner to the top left corner, and passes through points A and B.Supply curve S2 is a straight line with the same slope as S1, but plotted above.S2 passes through points D and C.Demand curve D1 is a straight line, which slopes down from the top left corner to the bottom right corner.Curve D1 intersects curve S1 at point A, and curve S2 at point D.Demand curve D2 is a straight line with the same slope as D1, but plotted above.Curve D2 intersects curve S1 at point B, and curve S2 at point C.
-Refer to Figure 14.1.The French fall in love with British Columbian wines and triple their purchases of this beverage.Assuming all else remains constant, this would be represented as a movement from
Definitions:
Inferior Good
A good for which a rise in income decreases the demand for the good.
Income Elasticity
A measure of how much the quantity demanded of a good changes in response to a change in consumers' income.
Peanut Butter
A food paste or spread made from ground, dry-roasted peanuts, often used as a sandwich filling or ingredient in various recipes.
Income Elasticity
Measures how the quantity demanded of a good responds to a change in consumer income.
Q10: If the exchange rate changes from $1.45
Q25: In the Sweet Action! supply chain,the flowers
Q36: Suppose the majority of the shares of
Q94: How would an increase in the Canadian
Q153: In order to maintain an undervalued yuan
Q170: The federal government debt equals<br>A)tax revenues minus
Q190: A decision by foreign central banks to
Q199: If the balance on the current account
Q205: Which of the following transactions would be
Q237: A decrease in the demand for Canadian-made