Figure 14.1 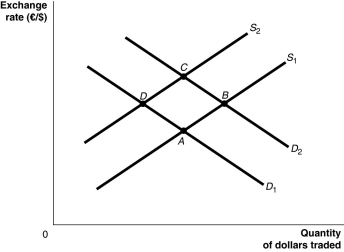 Alt text for Figure 14.1: In figure 14.1, a graph illustrates the quantity of dollars traded against the exchange rate.
Long description for Figure 14.1: The x-axis is labelled, quantity of dollars traded, and the y-axis is labelled, exchange rate, euros against dollars.2 supply curves; S1 and S2, and two demand curves; D1 and D2 are plotted.Supply curve S1 is a straight line which slopes up from the bottom left corner to the top left corner, and passes through points A and B.Supply curve S2 is a straight line with the same slope as S1, but plotted above.S2 passes through points D and C.Demand curve D1 is a straight line, which slopes down from the top left corner to the bottom right corner.Curve D1 intersects curve S1 at point A, and curve S2 at point D.Demand curve D2 is a straight line with the same slope as D1, but plotted above.Curve D2 intersects curve S1 at point B, and curve S2 at point C.
-Refer to Figure 14.1.Suppose that Canadian government deficits cause interest rates in Canada to rise relative to those in the European Union.Assuming all else remains constant, how would this be represented?
Definitions:
Hazardous Wastes
Hazardous wastes are materials that are dangerous or potentially harmful to people's health or the environment, often requiring special handling and disposal procedures.
Less-Hazardous Substances
Chemicals or materials that pose a lower risk to human health and the environment compared to their more dangerous counterparts.
Plastic
Synthetic or semi-synthetic organic compounds that are malleable and so can be molded into solid objects of diverse shapes, widely used for a variety of applications.
Recycled
The method of gathering and treating substances that would normally be discarded as waste and transforming them into new items.
Q26: Refer to Figure 13.4.Consider the shift in
Q31: If tax reduction and simplification are effective,
Q37: Suppose that domestic investment in Japan is
Q86: The year in which euro coins and
Q103: If changes in inflation are higher than
Q108: A(n)_ in private expenditures as a result
Q147: In the case of an upward-sloping aggregate
Q200: If expectations are adaptive, how will the
Q219: If inflation falls from 11% to 5%,
Q223: Long lags associated with the legislative process