Figure 14.2 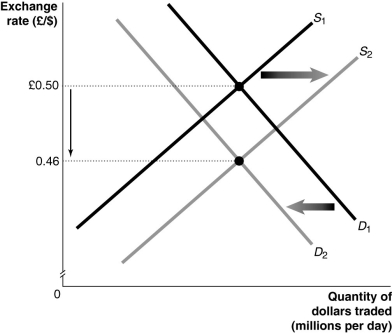 Alt text for Figure 14.2: In figure 14.2, a graph illustrates the quantity of dollars traded against the exchange rate.
Long description for Figure 14.2: The x-axis is labelled, quantity of dollars traded in millions per day, and the y-axis is labelled, exchange rate, British pound against Canadian dollars, with points 0.46 and British pound 0.50 marked.2 straight line supply curves, S1 and S2, slope up from the bottom left corner to the top right corner.Curve S2 is plotted to the right of curve S1.Demand curves D1 and D2 are straight line curves which slope down from the top left corner to the bottom left corner, with curve D2 plotted to the left of curve D1.Curves S1 and S2 intersect demand curves D1 and D2.The intersection point of curves S1 and D1 is connected to its corresponding y-axis value of British pound 0.50 with a dotted line.The intersection point of curves S2 and D2 is connected to its corresponding y-axis value of 0.46 with a dotted line.The intersection point of curves S1 and D1 is connected to its corresponding y-axis value of British pound 0.50 with a dotted line.A down pointing arrow indicates the difference between these values on the y-axis.arrow is shown between the 2 dotted lines.A right pointing arrow indicates the change from curve S1 to curve S2, and a left pointing arrow indicates the change from curve D1 to curve D2.
-Refer to Figure 14.2.Which of the events below would cause the shifts in the supply and demand curves in the market for Canadian dollars against the British pound shown in the graph above?
Definitions:
Overt-destructive
Characterized by clear, visible behaviors aimed at causing harm or damage, often observable in certain psychological conditions or situations.
Conduct Disorder
A pattern of behavior in children and adolescents marked by aggression towards people or animals, destruction of property, deceitfulness, theft, or serious violations of rules.
Overt-nondestructive
Refers to actions or behaviors that are openly performed without any intention to harm or destroy.
Juvenile Delinquency
Refers to illegal or antisocial behavior by minors.
Q23: What actions could the Bank of Canada
Q66: Calculate the government purchases multiplier if the
Q66: The success of a strategy depends on
Q93: If Canadian demand for purchases of Mexican
Q162: Increasing the federal budget deficit will contribute
Q163: When the value of a currency is
Q171: If national saving decreases,<br>A)the sum of domestic
Q182: In a closed economy with fixed or
Q247: Refer to Figure 13.2.Suppose the economy is
Q271: Monetary policy has a _ effect on