Figure 14.2 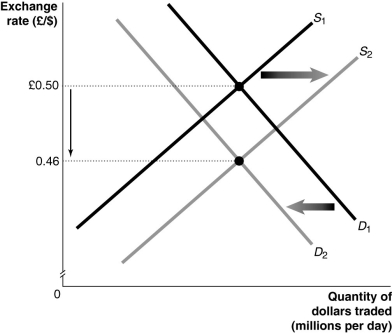 Alt text for Figure 14.2: In figure 14.2, a graph illustrates the quantity of dollars traded against the exchange rate.
Long description for Figure 14.2: The x-axis is labelled, quantity of dollars traded in millions per day, and the y-axis is labelled, exchange rate, British pound against Canadian dollars, with points 0.46 and British pound 0.50 marked.2 straight line supply curves, S1 and S2, slope up from the bottom left corner to the top right corner.Curve S2 is plotted to the right of curve S1.Demand curves D1 and D2 are straight line curves which slope down from the top left corner to the bottom left corner, with curve D2 plotted to the left of curve D1.Curves S1 and S2 intersect demand curves D1 and D2.The intersection point of curves S1 and D1 is connected to its corresponding y-axis value of British pound 0.50 with a dotted line.The intersection point of curves S2 and D2 is connected to its corresponding y-axis value of 0.46 with a dotted line.The intersection point of curves S1 and D1 is connected to its corresponding y-axis value of British pound 0.50 with a dotted line.A down pointing arrow indicates the difference between these values on the y-axis.arrow is shown between the 2 dotted lines.A right pointing arrow indicates the change from curve S1 to curve S2, and a left pointing arrow indicates the change from curve D1 to curve D2.
-Refer to Figure 14.2. Consider the market for Canadian Dollars against the British pound shown in the graph above.From this graph we can conclude that the dollar price of a British pound has ________ to ________ dollars per pound
Definitions:
Reverse Stock Split
A corporate action where a company reduces its total number of shares outstanding, thereby increasing the value of each remaining share.
Market Price
The present cost at which a service or asset is available for purchase or sale in the financial marketplace.
Residual Dividend
A policy by which dividends are paid to shareholders after all project capital needs and working capital requirements are met.
Positive Net Present Value
An indicator that an investment will generate more value than its cost, signifying its profitability.
Q5: If the Bank of Canada attempts to
Q22: The long-run aggregate supply curve is _,
Q37: Suppose that domestic investment in Japan is
Q68: Although the pegged exchange rate between the
Q135: Among countries that purchased Canadian stocks and
Q137: Refer to Figure 13.2.Suppose the economy is
Q176: A Canadian hospital hires radiology services from
Q177: If the dollar appreciates, how will aggregate
Q204: How is the impact of expansionary fiscal
Q240: If people assume that future rates of