Figure 14.4 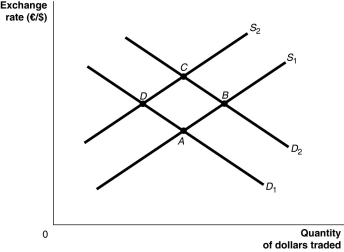 Alt text for Figure 14.4: In figure 14.4, a graph illustrates the quantity of dollars traded against the exchange rate.
Long description for Figure 14.4: The x-axis is labelled, quantity of dollars traded, and the y-axis is labelled, exchange rate, euros against dollars.2 supply curves; S1 and S2, and 2 demand curves; D1 and D2 are plotted.Supply curve S1 is a straight line which slopes up from the bottom left corner to the top right corner.It passes through points A and B.Supply curve S2 is a straight line with the same slope as curve S1, but is plotted to the right.Curve S2 passes through points D and C.Demand curve D1 is a straight line which slopes down from the top left corner to the bottom right corner.Curve D1 intersects curve S1 at point A, and curve S2 at point D.Demand curve D2 has the same slope as curve D1, but is plotted to the right Curve D2 intersects curve S1 at point B, and curve S2 at point C.
-Refer to Figure 14.4.The appreciation of the Canadian dollar is represented as a movement from
Definitions:
Entrepreneurs
Individuals who organize and operate businesses, taking on greater than normal financial risks.
Venture Capital Industry
The financial sector involved with providing funding to early-stage, high-potential, growth startup companies in exchange for equity or an ownership stake.
Pension Fund
A financial institution that collects and manages employees' retirement savings, investing that money to generate income for future pensions.
Economic Boom
A period of significant financial growth within a country or region, characterized by increased production and consumption.
Q2: An electronic commerce system:<br>A) is used to
Q18: The collection of people,technology,and systems within an
Q55: Which of the following is NOT a
Q56: Which of the major operations and supply
Q56: The Bretton Woods system was established in
Q59: When the operations and supply chain areas
Q62: Which of these is NOT one of
Q130: When the market value of the Canadian
Q169: If the rate of productivity growth in
Q178: What action should the Bank of Canada