Figure 14.4 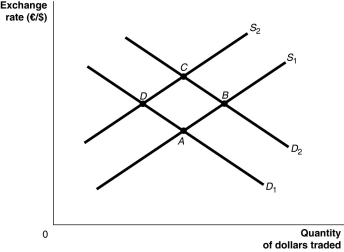 Alt text for Figure 14.4: In figure 14.4, a graph illustrates the quantity of dollars traded against the exchange rate.
Long description for Figure 14.4: The x-axis is labelled, quantity of dollars traded, and the y-axis is labelled, exchange rate, euros against dollars.2 supply curves; S1 and S2, and 2 demand curves; D1 and D2 are plotted.Supply curve S1 is a straight line which slopes up from the bottom left corner to the top right corner.It passes through points A and B.Supply curve S2 is a straight line with the same slope as curve S1, but is plotted to the right.Curve S2 passes through points D and C.Demand curve D1 is a straight line which slopes down from the top left corner to the bottom right corner.Curve D1 intersects curve S1 at point A, and curve S2 at point D.Demand curve D2 has the same slope as curve D1, but is plotted to the right Curve D2 intersects curve S1 at point B, and curve S2 at point C.
-Refer to Figure 14.4.The depreciation of the euro is represented as a movement from
Definitions:
Empirical Measure
A quantitative measure based on observation and experimentation, as opposed to theoretical analysis.
Variable
An element, feature, or factor that is liable to vary or change; in scientific experiments, it’s something that is controlled or manipulated to test hypotheses.
Normative Economic Reasoning
An approach in economics that reflects judgments about what the economy should be like or what particular policy actions should be recommended.
Financial Aid
Monetary assistance provided to individuals, typically students, to help cover the cost of education expenses.
Q1: When unemployment is below its natural rate,
Q5: Thailand's experience with pegging the baht to
Q20: When the market value of the dollar
Q21: Use the following information to draw a
Q69: Which of the following is not an
Q81: Refer to Figure 13.3.The shifts shown in
Q127: All other factors held constant, increased growth
Q143: If currency speculators decide that the value
Q150: The case for austerity is different in
Q214: An increase in the expected inflation rate