Figure 14.4 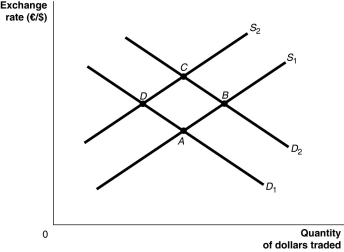 Alt text for Figure 14.4: In figure 14.4, a graph illustrates the quantity of dollars traded against the exchange rate.
Long description for Figure 14.4: The x-axis is labelled, quantity of dollars traded, and the y-axis is labelled, exchange rate, euros against dollars.2 supply curves; S1 and S2, and 2 demand curves; D1 and D2 are plotted.Supply curve S1 is a straight line which slopes up from the bottom left corner to the top right corner.It passes through points A and B.Supply curve S2 is a straight line with the same slope as curve S1, but is plotted to the right.Curve S2 passes through points D and C.Demand curve D1 is a straight line which slopes down from the top left corner to the bottom right corner.Curve D1 intersects curve S1 at point A, and curve S2 at point D.Demand curve D2 has the same slope as curve D1, but is plotted to the right Curve D2 intersects curve S1 at point B, and curve S2 at point C.
-Refer to Figure 14.4.Italians cut back on smoking and cut their demand for Canadian cigarettes in half.Assuming all else remains constant, this would be represented as a movement from
Definitions:
Capital Structure
The mix of a company's long-term debt, specific short-term debt, common equity and preferred equity, determining its financial stability and strategy.
WACC
Weighted Average Cost of Capital; an analysis of a company's capital expenditure costs, weighted proportionally across different capital categories.
Cost of Debt
The cost of debt is the effective rate that a company pays on its borrowed funds, accounting for interest expenses on all debts.
AA Rated
A credit rating given to bonds that indicates a very low risk of default and high level of creditworthiness.
Q3: If actual inflation is less than expected
Q16: In a closed economy with fixed or
Q42: Refer to Figure 13.11.A supply shock, such
Q53: The _ explains why an organization exists.
Q66: Of the three flows linking organizations in
Q100: When a Canadian investor buys a bond
Q121: By 2015, how many European countries were
Q129: If, at the current exchange rate between
Q180: The ability of the United States to
Q194: Refer to Figure 14.3.Consider the market for