Figure 14.4 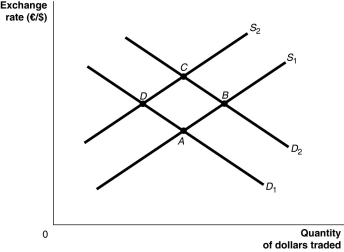 Alt text for Figure 14.4: In figure 14.4, a graph illustrates the quantity of dollars traded against the exchange rate.
Long description for Figure 14.4: The x-axis is labelled, quantity of dollars traded, and the y-axis is labelled, exchange rate, euros against dollars.2 supply curves; S1 and S2, and 2 demand curves; D1 and D2 are plotted.Supply curve S1 is a straight line which slopes up from the bottom left corner to the top right corner.It passes through points A and B.Supply curve S2 is a straight line with the same slope as curve S1, but is plotted to the right.Curve S2 passes through points D and C.Demand curve D1 is a straight line which slopes down from the top left corner to the bottom right corner.Curve D1 intersects curve S1 at point A, and curve S2 at point D.Demand curve D2 has the same slope as curve D1, but is plotted to the right Curve D2 intersects curve S1 at point B, and curve S2 at point C.
-Refer to Figure 14.4.Italians cut back on smoking and cut their demand for Canadian cigarettes in half.Assuming all else remains constant, this would be represented as a movement from
Definitions:
Assumptions
Premises or beliefs taken for granted without verification, often forming the basis of reasoning or an argument without being explicitly stated.
Social Inequalities
Differences in wealth, status, and power among individuals or groups within a society, often resulting from discrimination or unfair distribution of resources.
Poorer Health
A condition where an individual's physical or mental well-being is below an acceptable or expected standard.
Disadvantaged Groups
Communities or population segments that face social, economic, or political barriers limiting their access to opportunities and resources.
Q4: An increase in capital inflows will<br>A)increase net
Q11: Why would the Canadian trade deficit be
Q29: If the price of chicken wings in
Q36: Suppose the majority of the shares of
Q54: A study conducted by Robert Shiller, a
Q94: How would an increase in the Canadian
Q100: The fact that the prices for McDonald's
Q149: Proponents of the new classical macroeconomics do
Q156: Since 1965, the largest federal budget deficit
Q213: If a country sets a pegged exchange