Figure 15.4 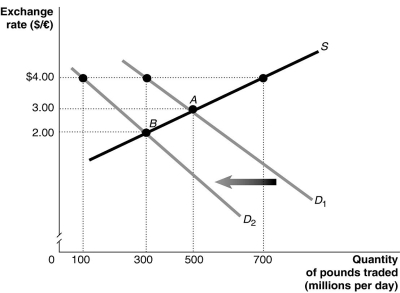 Alt text for Figure 15.4: In figure 15.4, a graph illustrates the quantity of pounds traded against the exchange rate.
Long description for Figure 15.4: The x-axis is labelled, quantity of pounds traded in millions per day.The y-axis is labelled, exchange rate, Canadian dollar against the pound.A straight line supply curve, S, slopes up from the middle left to the top right corner.2 straight line demand curves, D1 and D2, have 2 slightly different slopes.Both curves slope down from the top left corner to the bottom right corner.Curve D2 is plotted to the left of curve D1.The difference between the curves is indicated by a left pointing arrow.Curve S intersects curves D1 and D2 at points A (500, 3.00) and B (300, 2.00) .Point (300, 4.00) is plotted near the top of curve D1, and point (100, 4.00) is plotted near the top of curve D2.All points are connected to their corresponding values on the x and y-axes with dotted lines.
-Refer to Figure 15.4.The equilibrium exchange rate is at A, $3/pound.Suppose the British government pegs its currency at $4/pound.At the pegged exchange rate,
Definitions:
Customizing Department
A specialized unit within a company that modifies products to meet specific customer requirements or preferences.
Departmental Predetermined Overhead Rates
Overhead rates calculated for each department based on estimated costs and activity levels, used to allocate overhead costs to products.
Machine-Hours
Machine-Hours are a measure of the actual running time that a machine or group of machines operates during a given period.
Manufacturing Overhead
All indirect costs associated with the production process, such as utilities, rent, and salaries for support staff.
Q2: No one could turn around a failing
Q5: A set of logically related tasks or
Q36: Define mission statement and business strategy and
Q43: Distinguish between first-tier and second-tier suppliers in
Q44: Modelo,S.A.,is considering three providers of automated visual
Q57: The American-made car I purchased as a
Q77: The table depicts a production line that
Q91: Explain why economies with financial account surpluses
Q124: If the Bank of Canada chose to
Q179: Why do countries peg their currencies, and