Figure 15.4 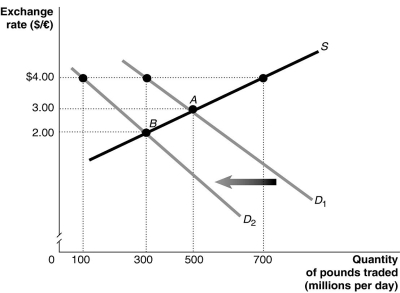 Alt text for Figure 15.4: In figure 15.4, a graph illustrates the quantity of pounds traded against the exchange rate.
Long description for Figure 15.4: The x-axis is labelled, quantity of pounds traded in millions per day.The y-axis is labelled, exchange rate, Canadian dollar against the pound.A straight line supply curve, S, slopes up from the middle left to the top right corner.2 straight line demand curves, D1 and D2, have 2 slightly different slopes.Both curves slope down from the top left corner to the bottom right corner.Curve D2 is plotted to the left of curve D1.The difference between the curves is indicated by a left pointing arrow.Curve S intersects curves D1 and D2 at points A (500, 3.00) and B (300, 2.00) .Point (300, 4.00) is plotted near the top of curve D1, and point (100, 4.00) is plotted near the top of curve D2.All points are connected to their corresponding values on the x and y-axes with dotted lines.
-Refer to Figure 15.4.The equilibrium exchange rate is at A, $3/pound.Suppose the British government pegs its currency at $4/pound.Speculators expect that the value of the pound will drop and this shifts the demand curve for pounds to D2.After the shift,
Definitions:
P-Value
The probability of obtaining test results at least as extreme as the observed results, assuming the null hypothesis is true.
Null Hypothesis
In statistics, a hypothesis that suggests no significant difference or effect, serving as the default assumption to be tested against experimental data.
P-Value
A statistical measure that helps scientists determine the significance of their research results, indicating the probability of observing the obtained results assuming that the null hypothesis is true.
Statistics Student
An individual engaged in the study of statistics, focusing on the collection, analysis, interpretation, and presentation of data.
Q40: Activities that take place prior to the
Q45: Which of the following statements about the
Q46: The time between completions of successive units
Q54: The _ capacity strategy attempts to adjust
Q64: Based on the following information, what is
Q149: China runs a current account surplus with
Q172: The Bank of Canada in 1989 and
Q206: What effect does a depreciation of the
Q220: If the implied exchange rate between Big
Q227: Assuming Canada is the "domestic" country, if