Figure 15.9 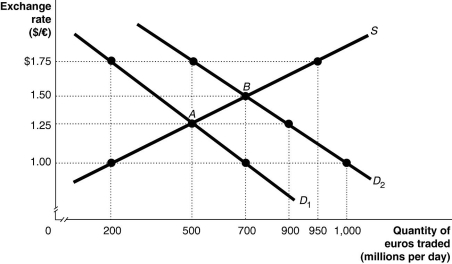 Alt text for Figure 15.9: In figure 15.9, a graph illustrates the quantity of euros traded against the exchange rate.
Long description for Figure 15.9: The x-axis is labelled, quantity of euros traded in millions per day.The y-axis is labelled, exchange rate, Canadian dollar against the euro.A straight line supply curve, S, slopes up from the bottom left corner to the top right corner.2 straight line demand curves, D1 and D2, slope down from the top left corner to the bottom right corner.Curve D2 is plotted to the right of curve D1.The difference between the curves is indicated by a right pointing arrow.Curve S intersects curves D1 and D2 at points A (500, 1.25) and B (700, 1.50) .Point (200, 1.00) is plotted near the bottom of curve S.Point (950, 1.75) is plotted near the top of curve S.Point (500, 1.75) is plotted near the top of curve D2.Points (900, 1.25) and point (1,000, 1.00) are plotted near the bottom of curve D2.Point (200,1.75) is plotted near the top of curve D1.Point (700, 1.00) is plotted near the bottom of curve D1.All points are connected to their corresponding values on the x and y-axes with dotted lines.
-Refer to Figure 15.9.The equilibrium exchange rate is at A, $1.25/euro.Suppose the European Central Bank pegs its currency at $1.00/euro.At the pegged exchange rate,
Definitions:
Hybridization
The process or act of combining or blending two different elements, such as cultures, technologies, or species, to produce something new or more effective.
Glocalization
A strategy that combines global approaches to local markets by adapting products or services to fit local cultures and preferences.
Multi-Cultural
Having, relating to, or representing several different cultures or cultural elements.
Standardized Global
involves applying uniform marketing strategies and product offerings across different countries and cultures, aiming for efficiency and consistency.
Q21: Forecasting counts suppliers and customers among its
Q29: If a logistics firm consistently makes deliveries
Q46: Refer to Figure 15.11.According to the graph,
Q51: Which of these represent the Six Sigma
Q57: The department chair is out of town
Q67: Every customer that exited the store was
Q149: When the value of a currency is
Q182: The current account does not include which
Q187: If net foreign investment in Canada is
Q209: The currency adopted by most countries in