Multiple Choice
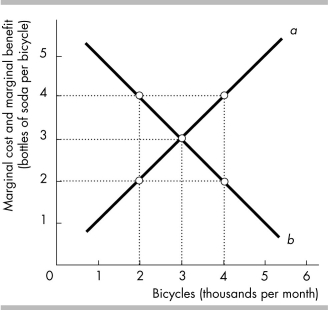
-In the above figure, the curve labeled a is the ________ curve and the curve labeled b is the ________ curve.
Definitions:
Related Questions
Q96: Suppose a factory can be designed to
Q216: The slope of a straight line is<br>A)
Q253: On a graph, high correlation between the
Q258: Consider the demand curves for soft drinks
Q264: Gruel is an inferior good. Hence, a
Q276: According to the figure above, the opportunity
Q282: A circular flow diagram shows the flows
Q313: In the figure above, if the quantity
Q384: If variables x and y move up
Q495: If shoes rise in price, the demand