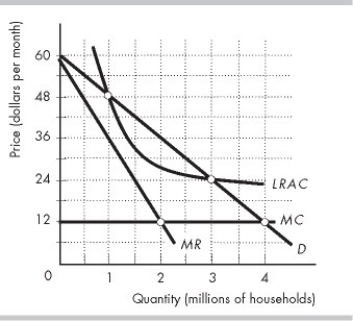
-The figure above shows the demand curve (D) faced by Visual, Inc., a cable TV company, and the firm's marginal revenue (MR) , marginal cost (MC) , and average cost (LRAC) curves. If Visual is regulated according to the social interest theory, it will serve ________ million households and set a price of ________ per household per month.
Definitions:
Marginal Utility
The bonus utility or pleasure experienced by someone when consuming another unit of a given good or service.
Risk-averse
A description of an individual's or entity's preference for avoiding loss over making a gain.
Expected Income
The income an individual anticipates to earn in the future based on current circumstances, potential investments, and employment prospects.
Utility Maximizer
An economic agent who seeks to achieve the highest level of satisfaction or utility from their choices, given their constraints.
Q57: Perfect price discrimination<br>A) turns all the producer
Q76: Natural gas is a natural monopoly. The
Q172: Brand names are an example of<br>A) economies
Q176: In a monopolistically competitive industry, the firms
Q187: Within a monopolistically competitive industry<br>A) firms can
Q218: The figure above provides information about Light-U-Up
Q220: If the demand for its product is
Q360: When an average cost pricing rule is
Q399: In the figure above, the total revenue
Q467: The primary reason why a monopoly can